经过 Pranay Yadav, Portfolio Analyst, Mint Finance
Capital Rotation: A Value Play Amidst Tariff Headwinds
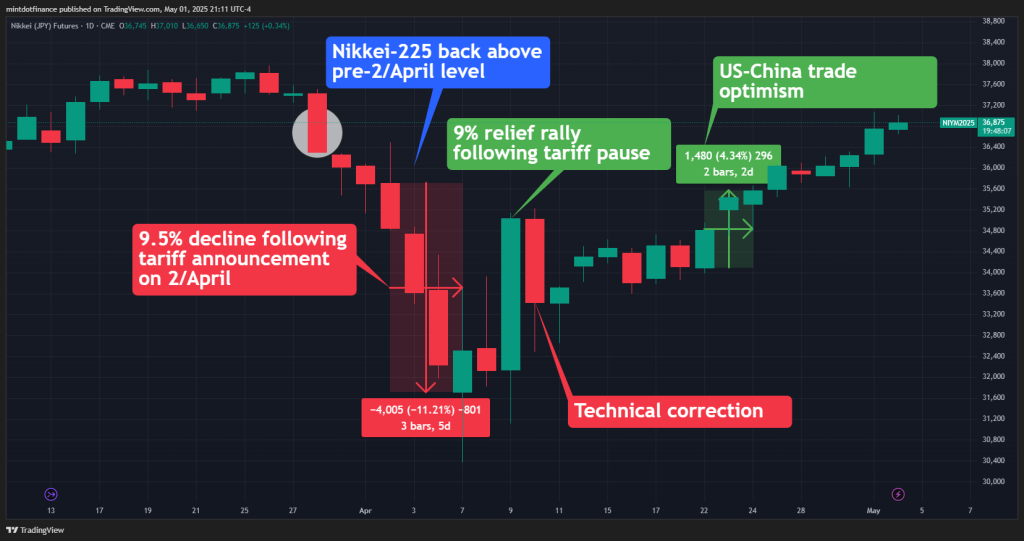
The US Liberation Day announcement on April 2 sent Nikkei 225 plunging. Subsequent tariff pause led to a strong rebound. Since then, Nikkei has recouped the losses.
Significant risks remain, making renewed weakness possible if tariffs are reinstated after the pause. Major Japanese stocks are heavily reliant on exports to the US. Any disruption significantly hurts their revenues. While examining the tariff impact through the shift in Bank of Japan (BOJ)’s monetary policy, the paper also unpacks recent trend of capital rotation into Japan market.
Chart 1: Nikkei 225 price action on tariff and its pause
来源: TradingView
Tariffs & Shifting BOJ Outlook
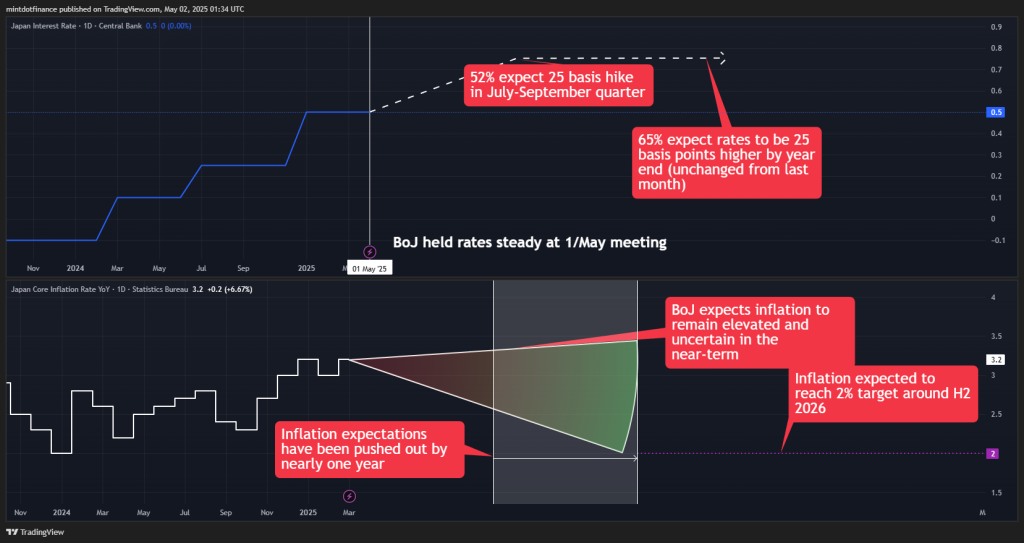
Trade tensions have cast a long shadow over Japan’s economic outlook. At its May 1 meeting, the BOJ held its short-term interest rate at 0.5%, while sharply cutting upcoming growth forecasts.
Market expectations of BoJ rate trajectory have shifted. In a recent Reuters poll, expectation of a rate hike in Q3 2025 declined from nearly two-thirds to just over 50%. Meanwhile, 84% of respondents do not anticipate any rate hikes at BoJ’s June meeting.
Chart 2: The outlook of BoJ rate hikes has been pushed further out, but the terminal rate by the end of 2025 remains unchanged.
来源: TradingView
The BOJ halved the projected GDP growth for fiscal 2025/26 (to 0.5%) and pushed back the timeline for hitting its 2% inflation target by a full year to 2026.
Governor Kazuo Ueda warned 那 “recent developments surrounding tariffs will weigh on Japan’s economy by slowing global growth, hurting corporate profits, and prodding households and companies to hold off on spending”.
Policymakers struck a cautious tone, noting “extremely” high uncertainty around the outlook and indicating they will gauge data carefully before adjusting rates.
Downside Risks from Export Weakness
Nikkei has heavy weighting toward major exporters. U.S. tariffs pose a significant risk to their revenues.
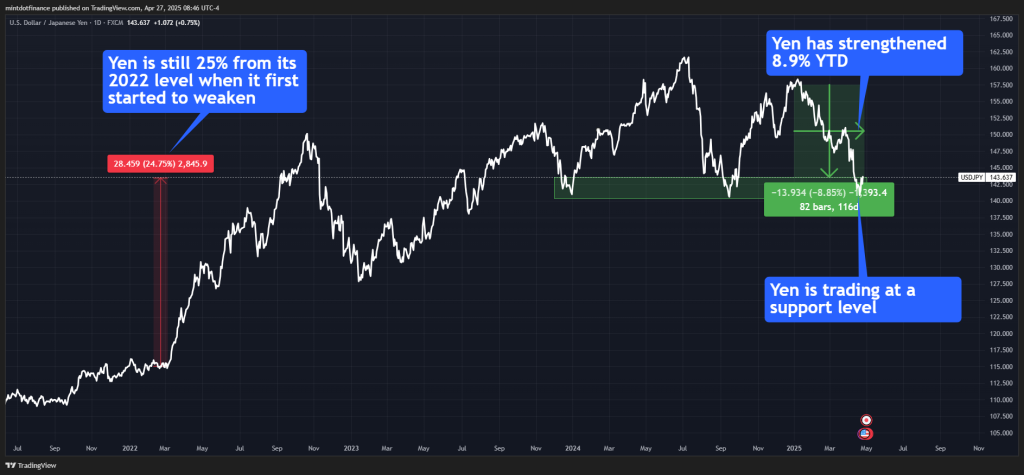
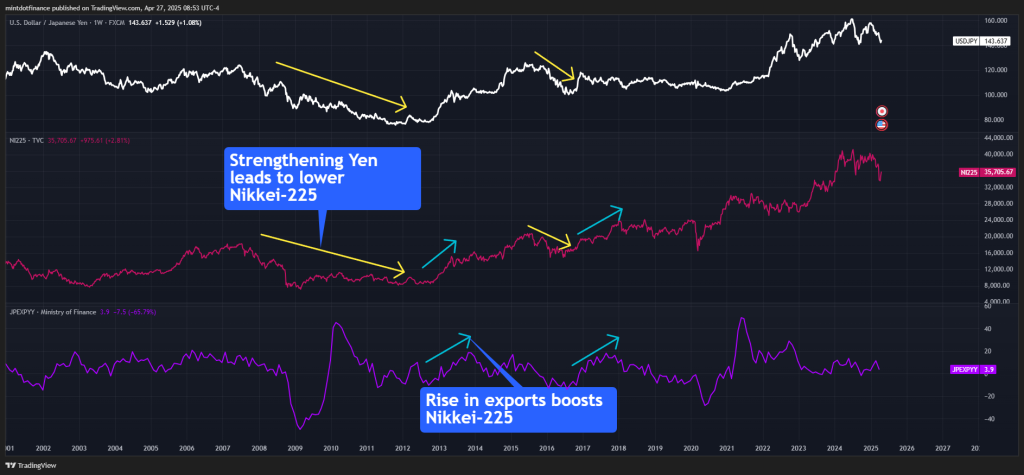
Beyond the direct revenue impact, exporters feel the heat of a strong yen. A weaker yen boosts profits when foreign earnings are converted, but as the yen strengthens, the profits tend to shrink due to currency effects.
According to Toyota, one yen change in the USD/JPY currency pair impacts its operating profit by 50 billion yen.
Chart 3: Yen has appreciated 8.8% against the dollar YTD but remains 25% weaker from its 2022 level.
来源: TradingView
Chart 4: Historically, the Nikkei 225 has shown weaker performance when export volume losses coincided with yen-driven margin compression.
来源: TradingView
In particular, the tariffs risk impacting the Nikkei 225’s heavy technology exposure.
Chart 5: The Nikkei 225 is dominated (47% weightage) by the tech sector
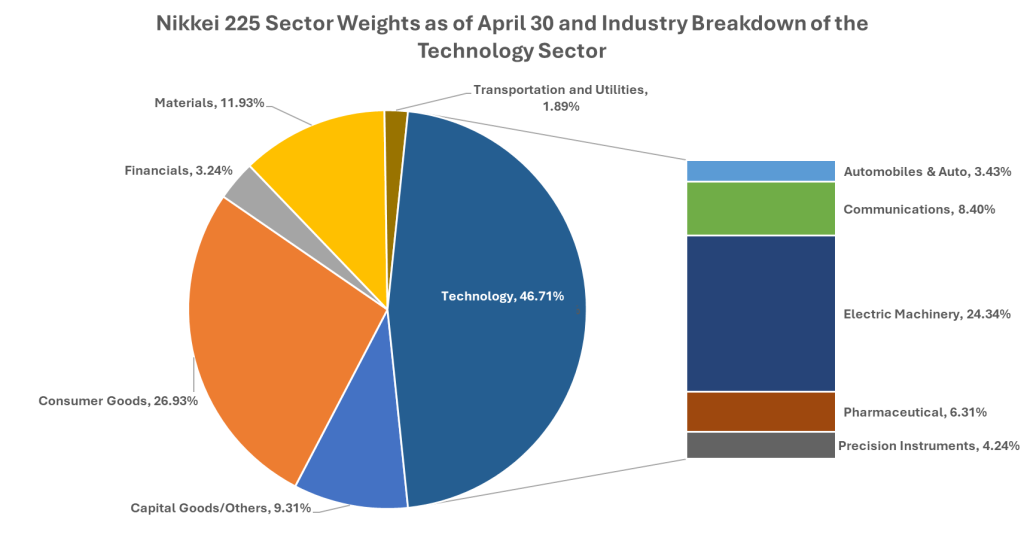
来源: Nikkei; as of April 30
In an earnings update, Tokyo Electron Management (which has a 5.6% weight) indicated a flat business environment for the year, citing a “lull in both automotive and power semiconductor investment, and investment by emerging Chinese manufacturers.” Strong growth is only expected in 2026.
The retail industry – a major index component (14%) – is dominated by Fast Retailing, which holds the single largest individual weight in the index at 11%.
Fast Retailing the holding company of Uniqlo chains, has already trimmed second-half profit guidance by roughly 2%-3% after accounting for potential duties, despite sourcing most U.S. inventory from lower-tariff Southeast-Asian plants.
Capital ReotationRotation to Japan Through the lens of P/E Convergence
Despite these challenges, global investors are increasingly rotating capital into international equities amid intensifying trade tensions.
EU defence stocks have surged. Chinese equities have risen. Japanese stocks stand to benefit too. Foreign funds were net buyers of Japanese stocks for three weeks in a row in April.
Chart 6: Net weekly foreign investment in Japan stocks has started to ramp up
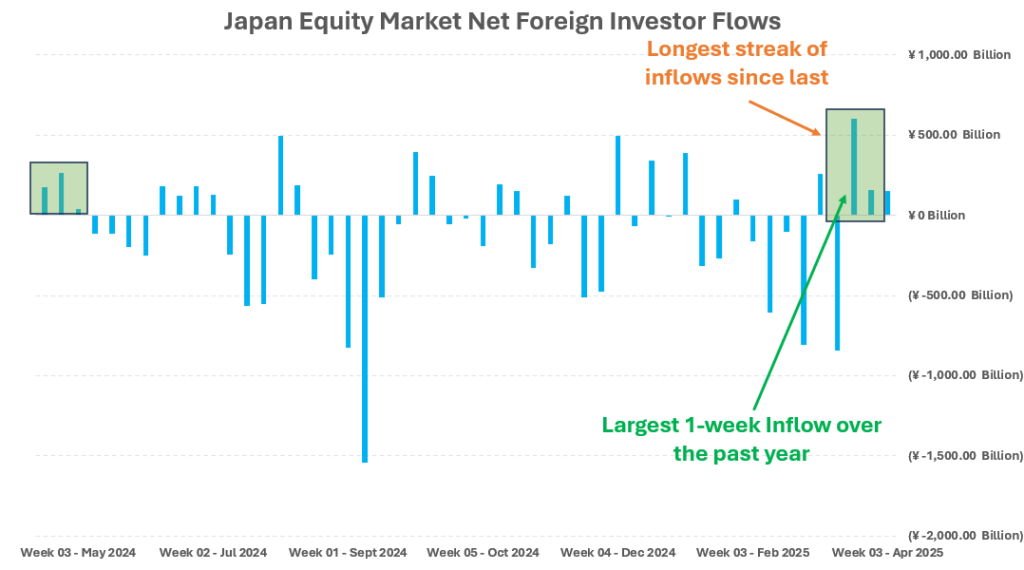
来源: TSE
Japan offers a compelling relative value story. The Nikkei 225 trades at a P/E ratio of 18.3, roughly 34% cheaper than the S&P 500 (27.9 P/E). This valuation gap stands at near multi-decade highs, suggesting room for P/E multiple convergence as Japan’s capital market attracts more inflows.
Chart 7: Nikkei 225’s P/E Ratio is substantially lower than S&P 500, suggesting the potential for P/E convergence

Conclusion
The tariff impact on Japanese equities is multi-faceted. Delay in BoJ rate hikes offers near-term support for the equity market, potential long-term effects on growth & inflation could offset these gains. Moreover, given Japan’s export-dependent economy, tariffs pose a significant revenue risk—particularly for firms with a high index weighting in the Nikkei 225. Many of these companies are already issuing more conservative outlooks for the year ahead.
Chart 8: Technical signals point to a bullish sentiment on Nikkei 225 although resistance is on the horizon
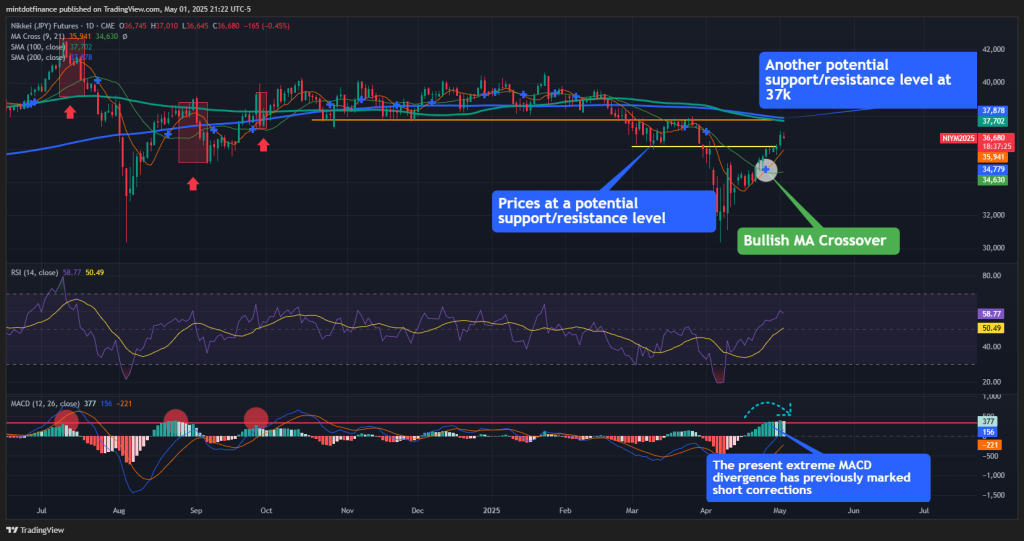
来源: TradingView
Investors expecting a favourable trade deal may opt for a long position on the Nikkei 225. A hypothetical trade setup is outlined below. In this case, the yen-denominated Micro Nikkei Futures contract could further enhance the profit in USD due to the anticipated strengthening of the yen.
Chart 9: Hypothetical long position on CME Micro Nikkei 225 (Yen) futures expiring in June
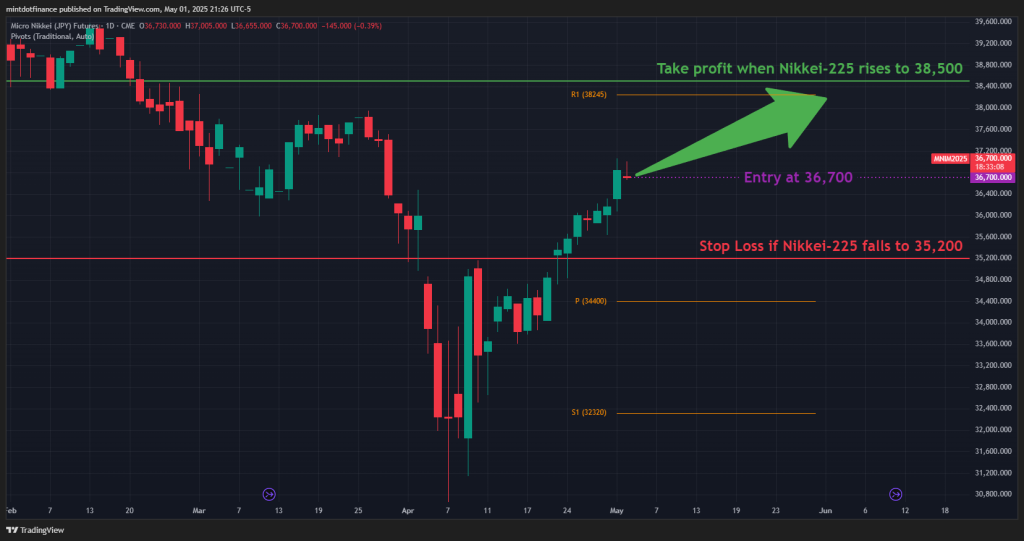
来源: TradingView
|
Entry |
If Nikkei 225 rises |
Stop Loss |
Potential Gains (JPY) |
Potential Losses (JPY) |
Reward-to-Risk |
|
36,700 |
38,500 |
35,200 |
JPY 90,000 ((38,500 – 36,700) x 50 yen/contract) |
JPY 75,000 ((35,200 – 36,700) x 50 yen/contract) |
1.2x |
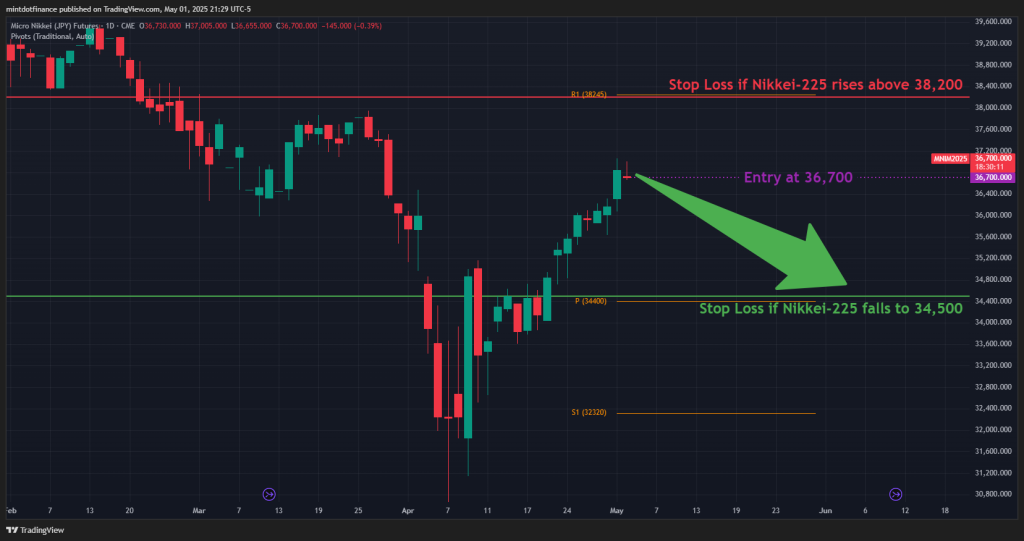
Conversely, investors anticipating the continuation of tariffs may consider taking a short position on the Nikkei 225.
Chart 10: Hypothetical short position on CME Micro Nikkei 225 (Yen) futures expiring in June
来源: TradingView
|
Entry |
If Nikkei 225 falls |
Stop Loss |
Potential Gains (JPY) |
Potential Losses (JPY) |
Reward-to-Risk |
|
36,700 |
34,500 |
38,200 |
JPY 110,000 ((36,700 – 34,500) x 50 yen/contract) |
JPY 75,000 ((36,700 – 38,200) x 50 yen/contract) |
1.47x |
For investors seeking to avoid directional exposure amid trade uncertainty, a spread trade may be suitable – going long CME Micro Nikkei 225 futures (USD-denominated) and short CME Micro E-mini S&P 500 futures.
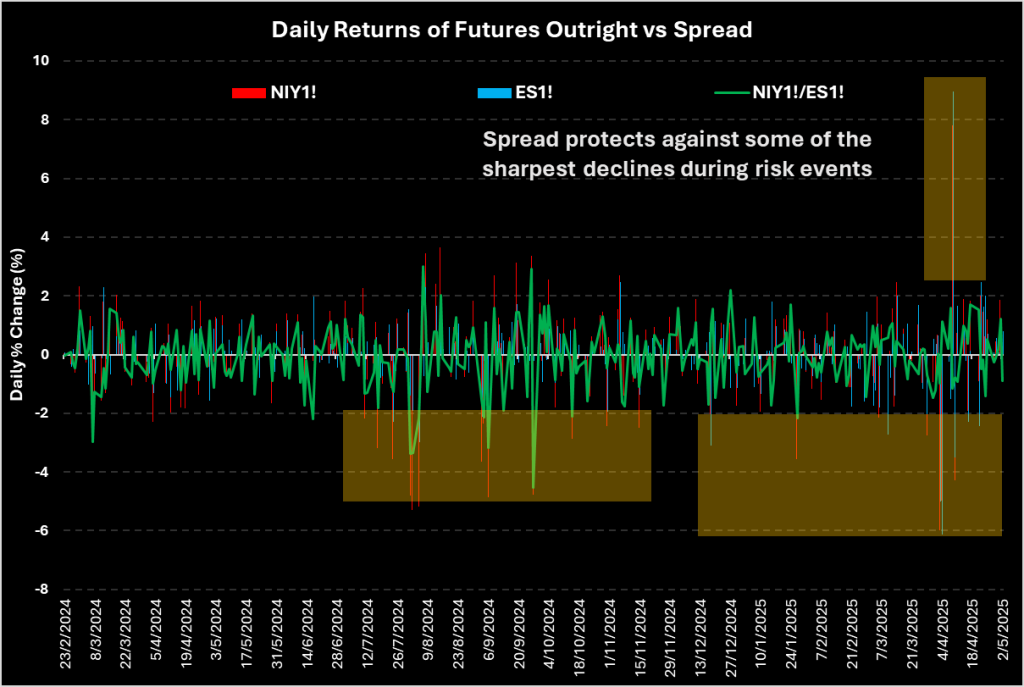
Why choose a spread trade? It helps reduce outright risk amid near-term uncertainty. With trade disruptions still unresolved, the outlook remains unclear.
A spread trade taps into the relative outperformance through P/E convergence, limiting downside while capturing divergences in equity performance.
Spread trades help hedge global market shocks—such as the one in early April—while still offering meaningful upside potential.
Chart 11: Nikkei 225/S&P 500 spread protects against a sharp decline during risk events
Source: TradingView
|
|
Largest Decline (Past Year) |
Largest Increase (Past Year) |
|
Nikkei 225 (Yen) Futures |
-6.0% |
7.8% |
|
E-Mini S&P 500 Futures |
-6.1% |
9.0% |
|
传播 |
-4.5% |
3.0% |
A position consisting of 3 x MNKM2025 ($55,170 in notional) and 2 x MESM2025 ($56,650 in notional) roughly balances notional on both legs, allowing for a purely relative outperformance-based trade.
In this trade setup, the Micro Nikkei 225 (USD) contract is used to keep the P&L on both legs in the same currency for simpler spread execution.
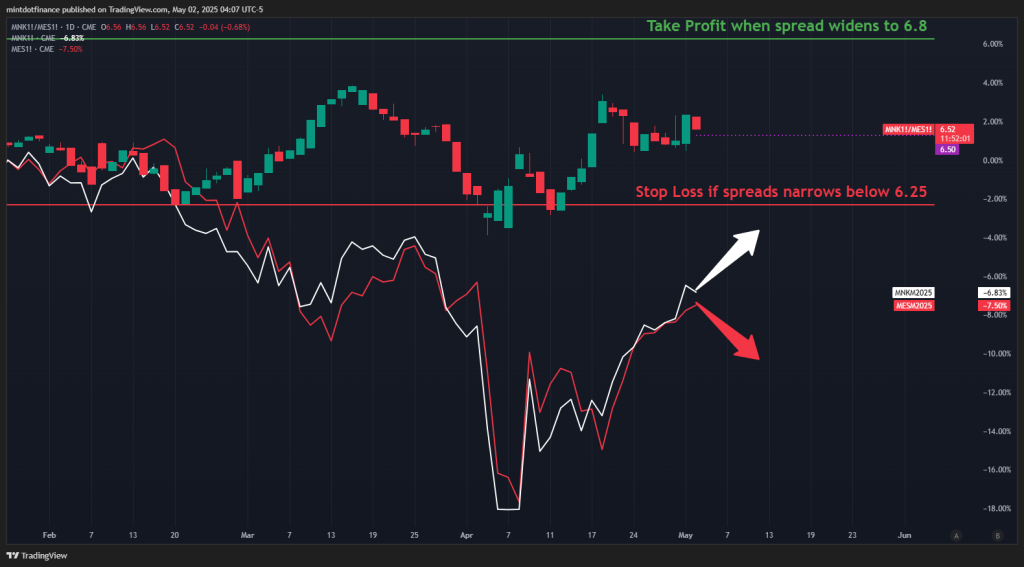
Chart 12: Hypothetical spread position between CME Micro Nikkei 225 (USD) and CME Micro E-mini S&P 500 expiring in June
来源: TradingView
|
|
Sell 2 MESM2025 |
Buy 3 MNKM2025 |
Ratio |
Hypothetical Profit/Loss |
|
Scenario 1 |
5,665 -> 5,409 |
36,780 (Unchanged) |
6.8 |
USD 2,560 (5665-5409) x 5 x 2 |
|
Scenario 2 |
5,665 (Unchanged) |
36,780 -> 38,522 |
6.8 |
USD 2,613 (38522-36780) x 0.5 x 3 |
|
Scenario 3 |
5,665 -> 5,885 |
36,780 (Unchanged) |
6.25 |
USD -2,200 (5665-5885) x 5 x 2 |
|
Scenario 4 |
5,665 (Unchanged) |
36,780 -> 35,406 |
6.25 |
USD -2,061 (35406-36780) x 0.5 x 3 |
Trade Nikkei 225 Futures from 10 Cents/Lot*
Trade Nikkei 225 Futures from just 10 cents/lot. Learn more 立即开户。 and access this low-cost opportunity to start trading CME Micro Nikkei 225 with ease.
The author’s views are independent and do not represent that of Phillip Nova. For applicable terms and conditions and a full risk disclaimer, please refer to www.phillipnova.com.sg. 该广告尚未得到新加坡金融管理局的审查。
Trade CFDs, ETFs, Forex, Futures, Options, Precious Metals, and Stocks with Phillip Nova 2.0
Features of trading on Phillip Nova 2.0
从 20 多个全球交易所的 200 多个全球期货中捕捉机会
Over 11,000 Stocks and ETFs across Singapore, US, China, Hong Kong, Malaysia and Japan markets.
View live charts and gain access to over 100 technical indicators
Trade CFDs, ETFs, Forex, Futures, Options, Precious Metals and Stocks on a single ledger on Phillip Nova 2.0


