
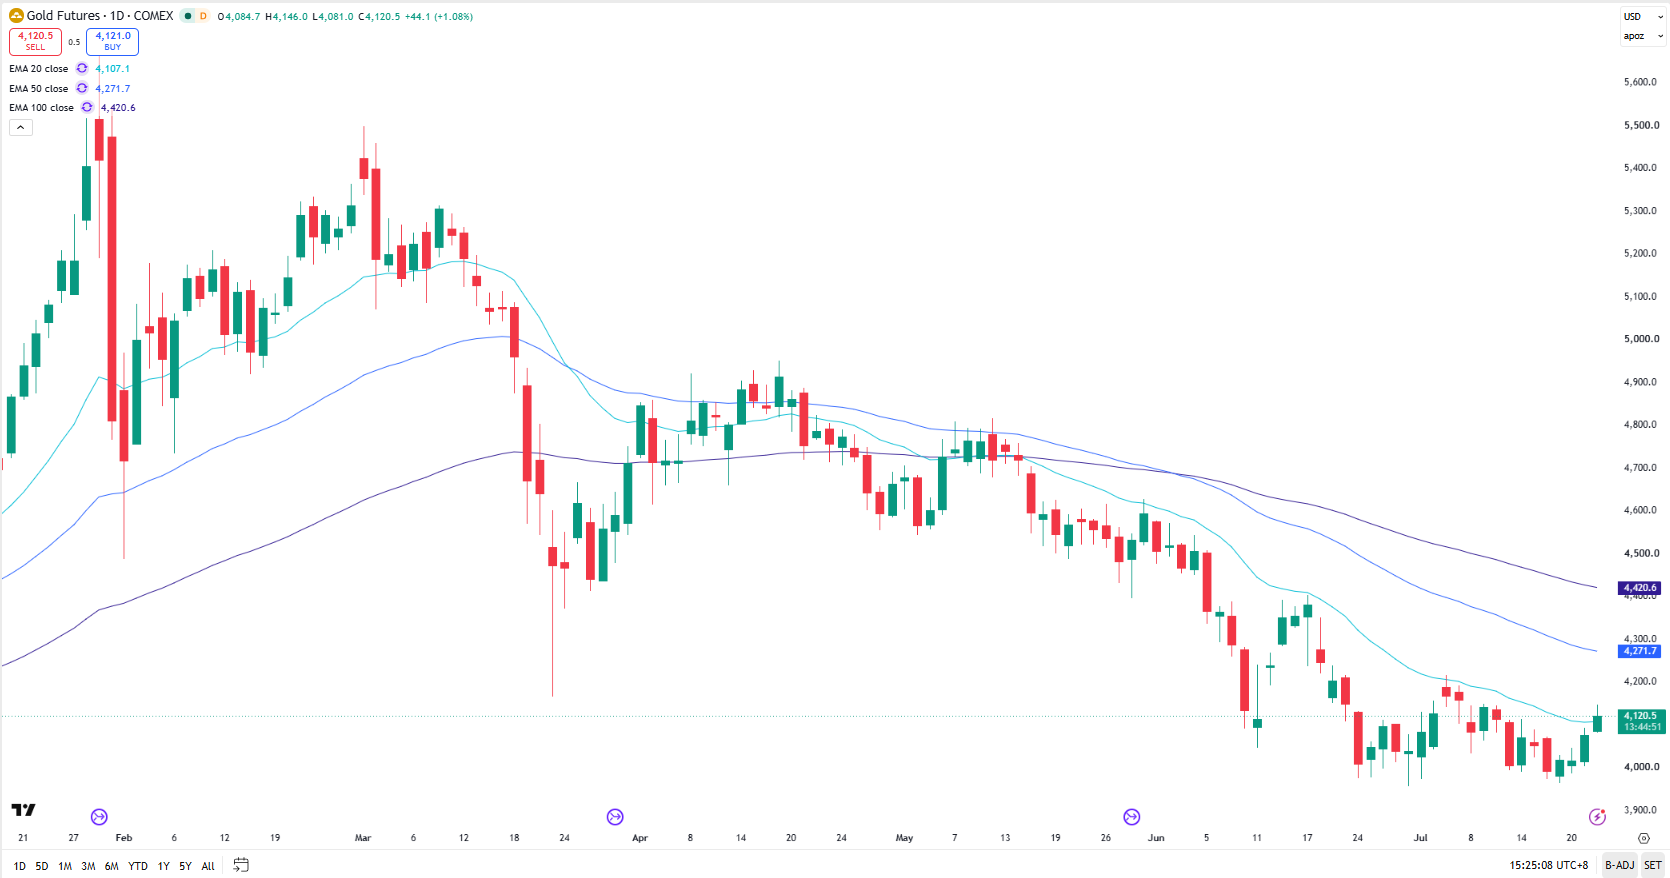
Gold has arrived at one of its most important price levels of the year.
After surging to record highs near US$5,600, bullion has retreated sharply, bringing prices back to the psychologically significant US$4,000 level. For some investors, this represents an attractive buying opportunity. For others, it raises the possibility that the correction is far from over.
The answer may depend less on technical charts and more on what happens next in inflation, interest rates and the Middle East.
From a technical perspective, US$4,000 represents more than a psychological milestone. The correction has also retraced approximately 61.8% of gold’s rally from late-2025 to its February 2026 peak, a Fibonacci level often viewed by technical analysts as an area where long-term trends may stabilise before resuming.
The fact that buyers have repeatedly emerged around this zone suggests that many longer-term investors continue to view the recent weakness as a correction rather than the start of a structural bear market. Central bank demand, which has remained resilient over recent years, may also provide an additional layer of longer-term support.
The US$4,000 region may also coincide with continued central bank demand. Over the past several years, central banks have remained consistent net buyers of gold, reinforcing the metal’s role as a strategic reserve asset.
Inflation May Be Gold’s Biggest Obstacle
Gold now finds itself caught between two opposing forces.
On one hand, geopolitical tensions continue to support demand for traditional safe-haven assets. On the other, persistent inflation could force central banks to keep interest rates higher for longer, strengthening the US dollar and increasing the opportunity cost of holding non-yielding assets such as gold.
Whichever force ultimately dominates is likely to determine gold’s next major move.
For now, US$4,000 remains the battlefield between bullish conviction and growing macroeconomic uncertainty.
Whether this level ultimately marks the end of the correction—or merely a pause before another leg lower—will depend less on Fibonacci retracements than on the next inflation report, Federal Reserve decision or geopolitical headline.
In today’s market, gold is no longer being driven by technicals alone. It is being shaped by the complex interplay between inflation, interest rates and global uncertainty.
通过 NOVA 关注黄金期货与期权市场动态,或查看相关 ETF、CFDs 及股票的价格走势。 了解更多详情。.
在 NOVA 交易 CFDs、ETF、外汇、期货、期权、贵金属和股票
NOVA 交易功能
- 接入超过 20 个全球交易所
从 20 多个全球交易所的 200 多个全球期货中捕捉机遇 - 全球股票的交易市场
覆盖新加坡、美国、中国、香港、马来西亚及日本市场,提供超过 11,000 只股票及 ETF。 - 由 TradingView 提供图表功能
查看实时图表,并使用超过 100 种技术指标。 - 真正的多资产交易体验
通过 NOVA 单一账本交易 CFDs、ETF、外汇、期货、期权、贵金属和股票。 - 美元及新元股票融资利率低至 4.5% p.a.
- 美股碎股低至 1 美元起
以低至 1 美元名义金额开始投资美股碎股,每笔订单佣金为 0.38 美元。