CN
 EN

OCBC’s share price has slipped since August. Is this a chance to buy, or a warning sign? Fundamental analysis using the NOVA platform helps us find out, starting here with OCBC.
On 7 August 2026, OCBC posted a record group net profit of SGD 2.2 billion for the second quarter of 2026 – up 22% year-on-year, beating analysts’ SGD 1.93 billion estimate. Total income grew 18% year-on-year to a new high of SGD 4.17 billion, with strength in fees, trading, and insurance offsetting a slight dip in interest income.
Group CEO Tan Teck Long summed it up: “We made SGD2.2 billion of profit this quarter, at a 22% growth rate.”
The market ran with it. By 28 August, OCBC shares were up 56.73% year-to-date at SGD 31.11.
Not every analyst is convinced. On 6 October, Citigroup analyst Tan Yong Hong downgraded OCBC to a sell with a target price of SGD 27.50, expecting flat year-on-year earnings in the third quarter and a lower CET1 ratio (the buffer of high-quality capital a bank holds to absorb losses) to “derail growth optimism for OCBC.” Since then, profit-taking has pulled the price down to SGD 28.11 as of 3 November – still up 41.61% year-to-date.
The share price shows what the market is feeling, not what the business is doing. Nova’s Key Indicators and Financials let us look behind it and ask whether this pullback is an opportunity or a sign of something the headline numbers hide.
What OCBC Does
OCBC (short for Oversea-Chinese Banking Corporation) is one of Singapore’s three big local banks, alongside DBS and UOB. Like any bank, it takes in deposits from everyday customers and businesses, then lends that money out (think home loans, business loans) – and pockets the difference between what it pays depositors and what it charges borrowers.
Beyond plain banking, OCBC also runs a sizable wealth management arm (through Bank of Singapore) and an insurance business (Great Eastern), with operations spanning Singapore, Malaysia, Indonesia, and Greater China.
Key Indicator Lens (Valuation, Margins, Returns, Growth, Health)
估值
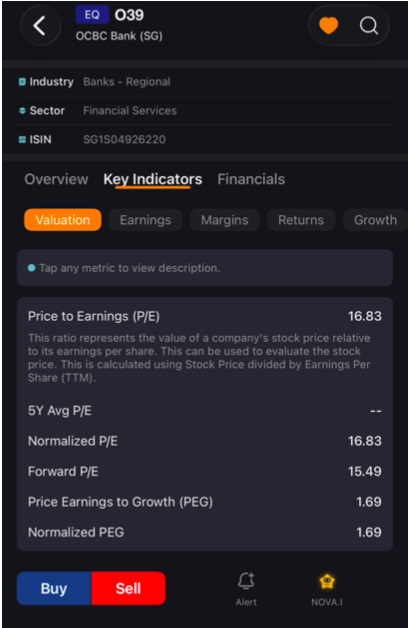
P/E (Price-to-Earnings) ratio tells you how much investors are paying for each dollar of OCBC’s profit. Generally, a lower P/E suggests a cheaper stock relative to its earnings, though it’s best judged against the company’s own history or similar companies rather than in isolation.
OCBC’s trailing P/E currently sits at 16.83x as of 3 November 2026.
Is 16.83x cheap or pricey? Ask NOVA.I
A P/E on its own doesn’t say much until you see what the other big banks are trading at. You can use NOVA.I to check how OCBC’s valuation stacks up against DBS and UOB:
“How does OCBC’s P/E compare with DBS and UOB?”
NOVA.I’s response
Trailing P/E comparison (TTM)
|
银行 |
股票代码 |
Trailing P/E |
Dividend yield |
Market cap (SGD) |
|
星展银行 |
D05 |
12.23x |
4.35% |
~202.5 bn |
|
华侨银行 |
O39 |
16.84x |
3.04% |
~126.5 bn |
|
大华银行 |
U11 |
7.36x |
3.93% |
~67.3 bn |
OCBC has the highest trailing P/E of the three at 16.84x, ahead of DBS at 12.23x and UOB at 7.36x. In other words, investors are paying more for each dollar of OCBC’s trailing earnings than for either peer. But P/E is not the most accurate indicator when it comes to the bank, so let’s take a look at the Price-to-Book ratio next.
Valuation
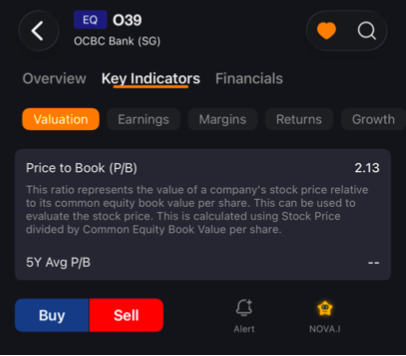
P/B (Price-to-Book) ratio tells you how much investors are paying relative to OCBC’s book value – roughly, the net worth of the company if you added up all its assets and subtracted its liabilities. This is a particularly common metric for banks, since a bank’s book value (loans, deposits, capital) tends to track its underlying business fairly closely.
OCBC’s P/B currently stands at 2.13x as of 3 November 2026. A P/B above 1.0x means investors are paying more than the accounting value of what the bank owns. Does a premium of this size reflect OCBC’s higher profitability, or is the market still pricing in more optimism than the Citi downgrade suggests?
Book Value Face-Off: Ask NOVA.I
A P/B only means something next to other banks. You can use NOVA.I to see how OCBC’s premium compares with DBS and UOB:
“How does OCBC’s P/B compare with DBS and UOB?”
NOVA.I’s response
Price-to-Book (P/B) Comparison – OCBC vs DBS vs UOB:
OCBC (O39): ~2.3x
DBS (D05): ~2.91x
UOB (U11): ~1.2x
What the ranking tells you
DBS trades at the richest multiple — roughly 3x book, well above peers. This premium is generally attributed to its higher return on equity (~17% versus ~12–13% for OCBC and UOB), stronger franchise in wealth and transaction banking, and a track record of superior shareholder returns.
OCBC sits in the middle at around 2.3x book, with ROE in the ~12.6% area. Its valuation has re-rated over the past year on improved capital returns and wealth-management momentum.
UOB is the cheapest at roughly 1.2–1.3x book, with ROE around 12.3%. The discount reflects a lower-return regional footprint (notably ASEAN exposure outside Singapore) and thinner non-interest income.
Valuation
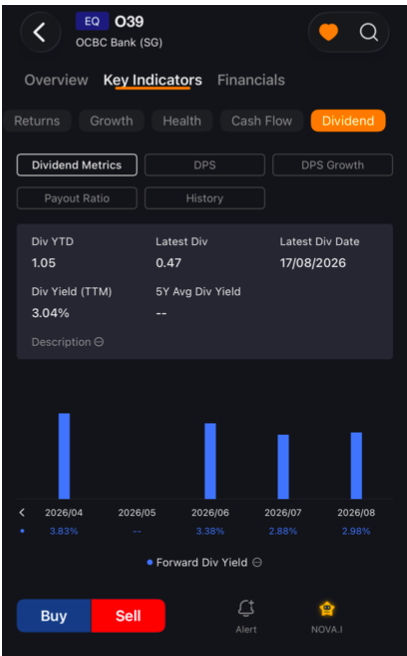
Dividend Yield tells you how much cash lands in your pocket each year just for holding the stock, relative to what you paid for it. As of 3 November 2026, that’s 3.04% for OCBC.
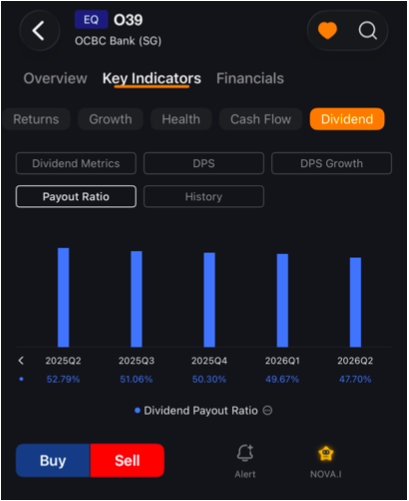
Payout Ratio tells you what portion of a company’s profit is paid out to shareholders as dividends, rather than kept in the business. OCBC’s payout ratio for the second quarter of 2026 was 47.70%, meaning 47.70 cents of every dollar of profit went to shareholders.
That sits close to management’s stated policy of paying out 50% of ordinary profit, a policy that just lifted the interim dividend to SGD 0.47 per share, up 15% from last year.
Curious about UOB and DBS’s dividend yield? Try NOVA.I
You can use Nova.AI to make a comparison, and see how OCBC stacks up against its competition:
“What’s the latest reported dividend yield and payout ratio for OCBC, DBS and UOB?”
NOVA.I’s response
Here are the latest available figures for the three Singapore banks. Dividend yields are trailing (based on the most recent 12-month distributions against the current share price), and payout ratios are the most recently reported full-year figures.
DBS: Trailing Dividend Yield ~4.3% | Dividend Payout Ratio ~55%
OCBC: Trailing Dividend Yield ~3.0% | Dividend Payout Ratio ~48%
DBS: Trailing Dividend Yield ~3.9% | Dividend Payout Ratio ~50%
Key points:
Dividend yields: DBS currently screens with the highest trailing yield of the three at about 4.3%, followed by UOB at about 3.9% and OCBC at about 3.0%.
Payout ratios: All three banks have historically distributed roughly 50–55% of earnings as dividends, a range that is generally considered well covered by earnings. DBS has tended to sit at the upper end of that band, while UOB has been closer to 50%.
Margins
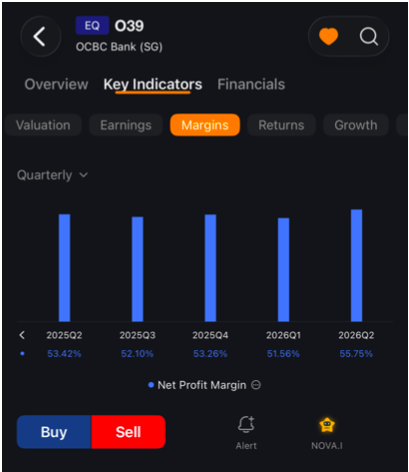
Net Profit Margin tells you how many cents of every dollar of income a bank keeps as profit, after everything – not just day-to-day operating costs, but also loan loss provisions, tax, and other items further down the income statement. OCBC’s net profit margin came in at 55.75% for the second quarter of 2026, up from 53.42% a year earlier, a rise of 2.33 percentage points.
A high net margin like this is a good headline number, but it can be driven by several different things at once – tighter cost control, lower loan-loss provisions, or even one-off gains elsewhere in the business. To get a more complete picture, it’s worth checking a narrower efficiency metric alongside it.
Want to dig deeper? Try NOVA.I
Net margin tells you the end result, but not why it got there. Cost-to-Income Ratio (CIR) – operating expenses divided by total income – isolates just how efficiently a bank is run day-to-day, stripped of things like credit costs or one-off items. Instead of digging through the financials to calculate it yourself, try asking Nova.AI:
“What is OCBC’s cost-to-income ratio for the latest quarter, and how has it changed from the previous quarter?”
This gives you a fuller picture: is OCBC’s strong margin coming from genuine operational efficiency, or is something else doing the heavy lifting?
NOVA.I’s response:
Based on OCBC’s 1H 2026 results released on 7 August 2026, the Group’s cost-to-income ratio (CIR) for the second quarter of 2026 was 37.8%. This improved both year-on-year and quarter-on-quarter — it was down from 39.3% in Q1 2026 and from 38.7% in Q2 2025. For the first half of 2026 as a whole, the CIR improved to 38.5%, versus 39.7% in 1H 2025.
The improvement was driven by strong income growth — total income rose 18% in Q2 2026, supported by a 51% jump in non-interest income (including an 85% increase in trading income) — while operating expenses remained well managed. This efficiency gain contributed to OCBC’s record first-half net profit of S$4.19 billion, up 13% year-on-year.
Note that these figures are from OCBC’s official 1H 2026 results announcement. The next update will be the Q3 2026 results, expected around early November 2026.
退货
Return on Equity (ROE) tells you how effectively a bank turns
shareholders’ money into profit.
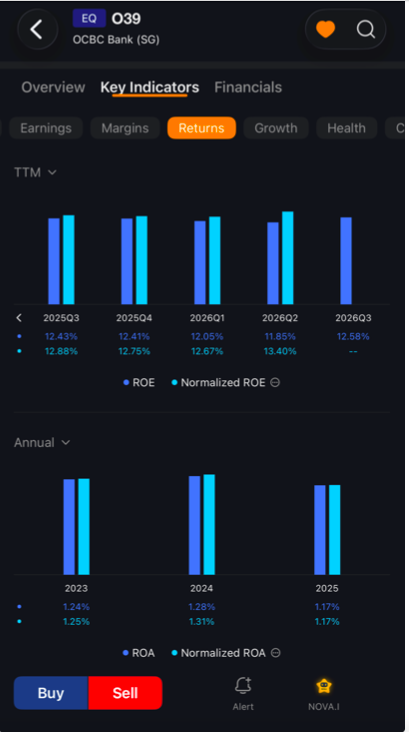
OCBC’s ROE came in at 11.85% on a trailing twelve month (TTM) basis for the period ending the second quarter of 2026. TTM adds up the latest four quarters instead of looking at one, which smooths out lumpy quarters.
Return on Assets (ROA) tells you how efficiently a bank turns its assets (loans, investments, cash and more) into profit, regardless of how those assets are funded (deposits, borrowings or shareholders’ equity).
OCBC’s ROA came in at 1.10% on the same TTM basis.
Over the last four quarters, OCBC’s ROE has ranged from 11.85% to 12.43% and its ROA from 1.10% to 1.17%, with both edging lower each quarter even as the bank reported a record quarterly profit in 2026 Q2. Trailing figures move slowly, but this is also worth watching alongside the capital buffer covered under Health.
Growth
Diluted EPS (earnings per share) growth tells you how much a company’s profit per share has grown compared with the same quarter a year earlier.
“Diluted” means it also allows for extra shares that could be created later, such as employee share awards, so it captures both profit growth and any change in the number of shares.
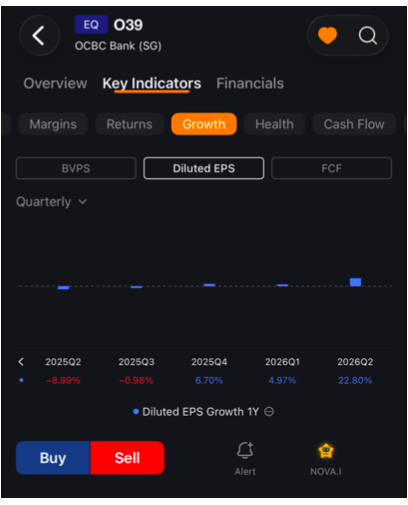
OCBC’s diluted EPS grew 22.80% year-on-year in the second quarter of 2026, up from 4.97% in the first quarter. A year earlier, in the second quarter of 2025, it had fallen 8.89%, so the latest growth is measured from a lower starting point.
A growth rate tells you how much earnings per share grew, not why. A jump from 4.97% in the first quarter to 22.80% in the second makes the “why” worth checking. You can use NOVA.I to look behind the number:
“What drove OCBC’s second quarter 2026 earnings growth?”
NOVA.I’s response
OCBC Q2 2026 (reported early August 2026): the growth was driven mainly by non-interest income, led by wealth management, which more than offset softer net interest income.
Key points from the reported results:
Net profit rose about 22% year on year to roughly S$2.22 billion, beating consensus expectations.
Non-interest income was the main engine. A surge in wealth-management-related fees drove the increase, with fee income broadly strong across the group. This continued the pattern seen in Q1 2026, when non-interest income rose 23% and fee income climbed 24%, again led by wealth management.
Net interest income was the offsetting drag. Net interest margin compressed as rates fell, so lending income did not contribute to the growth — the profit expansion came from the non-interest side of the book.
First-half context: Group net profit for H1 2026 rose 13% year on year to a record S$4.19 billion, with total income up 11% to S$8.00 billion.
NOVA.I’s answer is clear on one thing: the growth did not come from lending. Net interest margin compressed as rates fell, so the profit expansion came from non-interest income, led by wealth management fees. Over the first half, net profit rose 13% to S$4.19 billion and total income rose 11% to S$8.00 billion. With lending income not contributing, how much of OCBC’s growth do you think rests on wealth management continuing to deliver?
Health
CET1 (Common Equity Tier 1) ratio tells you how big a financial cushion a bank holds to absorb losses. It compares the bank’s highest-quality capital, mainly shareholders’ equity and retained profits, against the loans and other risks on its books. Regulators set a minimum that every bank must stay above.
How thick is the cushion? Ask NOVA.I
CET1 is not a Key Indicator metric on the platform, but this is a good example of where NOVA.I fills the gap. Try asking:
“What is OCBC’s CET1 ratio as at 30 June 2026, how does it compare with a year earlier, and what is the minimum CET1 ratio its regulator requires?”
NOVA.I’s response
OCBC’s Common Equity Tier 1 (CET1) capital ratio was reported at 14.3% as at 31 March 2025, stable quarter-on-quarter and up about 50 basis points year-on-year. That sits within the bank’s medium-term target range of roughly 14.0%–14.5%, and comfortably above the regulatory minimum (around 10.6% including buffers).
A few points on how to read this:
Definition: CET1 is the highest-quality capital (paid-up ordinary shares plus retained earnings, net of regulatory deductions) divided by risk-weighted assets. It is the main gauge of a bank’s loss-absorbing buffer.
Trend: OCBC has been running a relatively high CET1 level, which supports dividend capacity and buyback flexibility, though it also raises the question of capital efficiency versus peers.
Peer context: DBS and UOB have also been operating in the mid-to-high teens range, so OCBC’s buffer is sound but not uniquely high.
It should also be noted that the cushion (CET1) has a cost: capital that sits unused could instead be lent out to grow the business or paid to shareholders as a higher dividend. Neither a thinner nor a thicker cushion is automatically better, because the right level depends on how much risk a bank wants to carry and how much growth it sees. So when you look at OCBC’s CET1 ratio, does it read as prudence, or as capital that could be working harder?
Company KPIs:
CASA Ratio tells you what portion of a bank’s total deposits come from low-cost current and savings accounts, rather than pricier fixed deposits that require paying customers a higher interest rate.
A higher CASA ratio generally means cheaper funding for the bank, which helps protect its lending margins. OCBC’s CASA ratio stood at 49.3% as at 30 June 2026, down slightly from 50.2% the previous quarter – even as CASA deposits themselves kept growing, they grew a little slower than the bank’s fixed deposits over the quarter.
Who’s got the cheapest money? Try NOVA.I
A 49.3% CASA ratio sounds fine in isolation, but “fine” is relative – Singapore’s three local banks compete hard for the same low-cost deposits, so the real test is how OCBC stacks up next to DBS and UOB. Ask Nova.AI:
“CASA ratios of OCBC, DBS and UOB, latest quarter. Figures and Q2 only, one line each. Then name the highest.”
NOVA.I’s response
Based on the latest reported quarter (Q2 2026, ended 30 June 2026), the CASA ratios are:
DBS: 52% (Q2 2026) OCBC: 50% (Q2 2026) UOB: 55% (Q2 2026) Highest: UOB
Note: These figures are based on the most recent quarter-end disclosures available; UOB’s ratio reflects the highest among the three.
Industry Spotlight:
How does OCBC really compare? Try NOVA.I
NIM (Net Interest Margin) and NPL (Non-Performing Loan) Ratio are two of the most-watched numbers for any bank, but comparing OCBC’s figures against its closest local peers – DBS and UOB – means digging through separate results releases, one bank at a time.
This is exactly where Nova.AI, the AI assistant built into the Phillip Nova app, comes in handy. Instead of tracking down each bank’s numbers yourself, try asking:
“NIM and NPL ratios for OCBC, DBS and UOB, latest quarter. One line each with the quarter. Then one line on which is holding up best.”
NOVA.I’s response
Based on the most recent reported quarter (2Q FY2026, results released August 2026):
OCBC – NIM 1.73%, NPL ratio 0.9% (2Q FY2026). DBS – NIM 1.87%, NPL ratio 1.0% (2Q FY2026). UOB – NIM 1.74%, NPL ratio 1.6% (2Q FY2026).
Holding up best: OCBC is holding up best on asset quality, with the lowest NPL ratio at 0.9% (and it has been improving), while DBS shows the most resilient net interest margin at 1.98%. UOB trails on both fronts, with the highest NPL ratio at 1.6% and a lower NIM of 1.91%.
Note: Figures are drawn from public reporting for the latest quarter; exact NIM/NPL figures can vary slightly by reporting basis, so please verify against the banks’ official results releases.
Verifying with the Financials
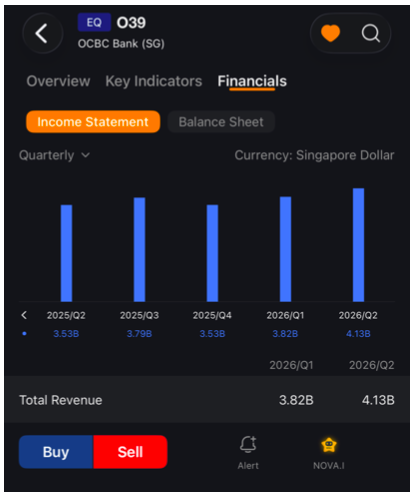
Income Statement: Total Revenue. Total revenue is all the money a bank brings in before paying out its own costs, including the interest it earns on loans and the fees it charges. Nova shows OCBC’s total revenue at SGD 4.13B for the second quarter of 2026, compared with SGD 3.82B in the first quarter of 2026 and SGD 3.53B in the second quarter of 2025.
Revenue is SGD 0.31B higher than the previous quarter and SGD 0.60B higher than a year earlier.
That growth is what the market will be watching when OCBC reports its third-quarter results on 6 November. One quarter of higher revenue doesn’t make a trend, so investors will be looking at whether revenue holds at this level or keeps climbing.
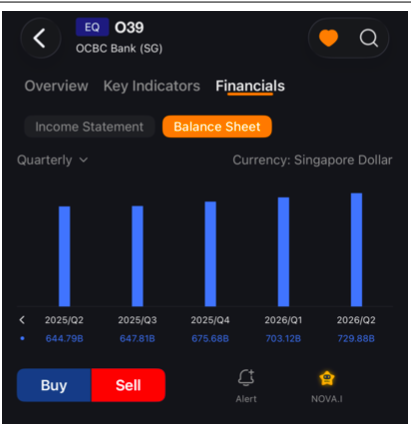
Balance Sheet: Total Assets. Total assets are everything the bank owns, mainly loans, investments and cash. This is a snapshot at the end of each quarter, not a twelve-month total. OCBC’s total assets were SGD 729.88B in the second quarter of 2026, compared with SGD 703.12B in the first quarter of 2026 and SGD 644.79B in the second quarter of 2025.
That is SGD 85.09B more than a year earlier. ROA in Returns divides profit by assets, so a larger asset base means profit has more to cover.
Takeaway
OCBC delivered a record first half in 2026 – profit, income, and wealth management all hit new highs.
But for a bank, growth alone doesn’t tell the whole story: revenue comes from several moving parts (lending, fees, trading, insurance) that can offset each other, and asset quality (NPL ratio) and capital strength (CET1) matter just as much as the pace of growth.
So next time you check a bank’s results, don’t just ask “did profit go up?” – ask “where did it come from, and is the foundation getting stronger or weaker?”
You’ve seen the numbers, now it’s your call. Where do you land on OCBC?
● Very bullish
● Bullish
● Neutral
● Bearish
● Very bearish