
介绍
In today’s dynamic Forex market, understanding when to enter or exit a trade is a key part of effective risk management. As 2025 unfolds, diverging central bank policies, shifting geopolitics, and the growing influence of algorithmic trading are fueling volatility and liquidity swings, presenting both opportunities and challenges for retail traders.
Within this environment, well-established technical indicators such as the RSI, MACD, 和 EMA remain valuable tools for market analysis. When applied appropriately, these indicators can help traders interpret market trends, assess momentum, and manage positions with greater discipline and consistency.
This guide explores how combining RSI, MACD, and EMA can help Singapore-based Forex traders navigate Forex markets in the final quarter of 2025 with greater confidence.
Understanding What Each Forex Indicator Means and How to Read Them
Before combining them, it helps to understand what each indicator measures and how they guide trading decisions.
- RSI (Relative Strength Index) measures market momentum and identifies potential overbought and oversold conditions.
- MACD (Moving Average Convergence Divergence) tracks momentum and potential trend reversals.
- EMA (Exponential Moving Average) highlights prevailing trend and dynamic support or resistance zones.
RSI: Measuring Momentum and Market Exhaustion
The RSI is a momentum oscillator that ranges from 0 to 100 showing how quickly prices rise or fall over a set period (typically set as 14 candles on chart).
- Key Signals:
Overbought / Oversold levels: RSI above 70 ssuggests the market is overbought; below 30 indicates oversold conditions.
Centerline (50): RSI above 50 reflects bullish momentum; below 50 signals bearish momentum.
Divergence: When price makes a new high or low, but RSI doesn’t follow the same trend, it often signals a possible loss of strength and a possible reversal.
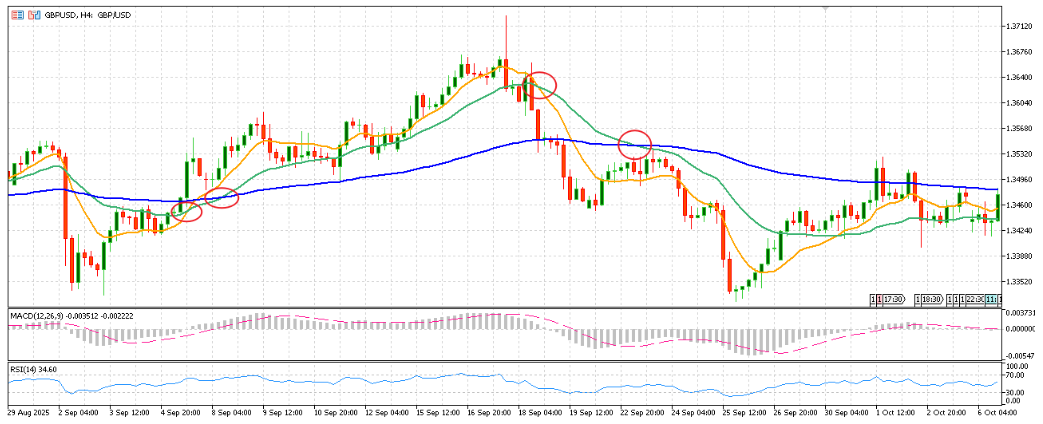
Example: Reading RSI(14) on 4H GBP/USD chart
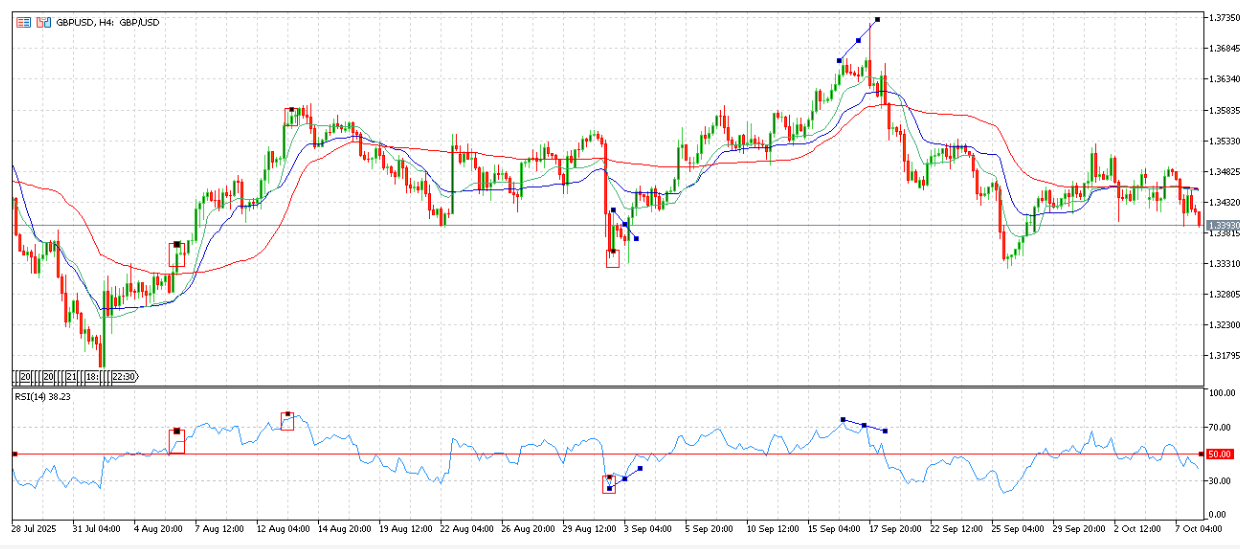
4-7 Aug: RSI stayed above 50, showing strong buying pressure.
12-14 Aug: RSI rose above 70, signalling an overbought condition.
29 Aug – 3 Sep: RSI dipped below 30, marking an oversold level. A bullish divergence then appeared, RSI rose while prices form a triangle, hinting a weaker selling pressure and potential rebound.
15 Sep – 17 Sep: Price made new highs while RSI trended lower, forming a bearish divergence signalling a bearish shift.
Moving Average Convergence Divergence (MACD): Tracking Trend and Momentum
The MACD is a trend-following momentum indicator based on three Exponential Moving Averages, usually 12, 26 and 9-period EMAs.
Components:
- MACD Line measure the difference between 12-period and 26-period EMA
MACD Line rises above 0 when short-term-period EMA outpaces the longer-term-period EM and falls below 0 when momentum weakens.
- Signal Line is a 9-period EMA
- MACD Histogram measures the difference between the MACD and Singal lines
Key Signals:
- Crossover Signals: When the MACD Line crosses above the Signal Line, it signals potential bullish momentum; a cross below suggests bearish pressure.
- Zero Line Cross: When the MACD histogram moves from negative to positive, buying pressure is higher than selling pressure and vice versa.
- Histogram bars: Expanding histogram bars show increasing trend strength, while shrinking bars indicate weakening momentum.
Example: Reading MACD(12, 26, 9) on 4H GBP/USD chart
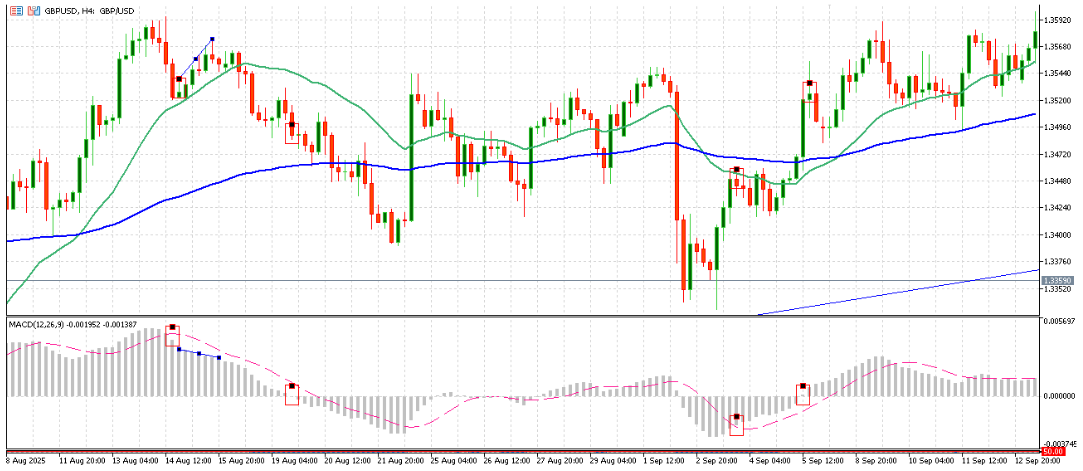
14-15 Aug: A bearish MACD crossover occurred, with the histogram goes below MACD Signal Line (dash line) followed by a bearish divergence where price candles went up while histogram declined.
19-20 Aug: The MACD histogram dropped below zero, aligning with a price downturn and stronger selling momentum.
2–5 September: A bullish MACD crossover occurred, with the histogram bar crossing above MACD Signal Line and then turning from negative to positive, signalling sustained buying momentum.
Exponential Moving Average: Riding the Trend with Confidence
这 Exponential Moving Average (EMA) is a trend indicator that give more weight to recent prices than simple moving average so it reacts faster to price shifts.
Popular EMA Settings:
- 20 EMA: Captures short-term price swings.
- 50 EMA: Represents medium-term trends.
- 200 EMA: Acts as the long-term benchmark.
How to read it:
- When a shorter EMA (e.g., 20) crosses above a longer one (e.g., 50), it suggests bullish momentum; crossing 以下 signals bearishness.
- A 黄金十字 (50 above 200) points to sustained bullish sentiment, while a Death Cross (200 above 50) signals prolonged weakness.
- Price holding above the 200 EMA shows buyers in control; staying below indicates sellers dominating.
Strategy Combining RSI, MACD an EMA
Each indicator brings a different perspective: MACD reveals changes in price momentum, EMA defines the prevailing trend, and RSI signals trend strength and exhaustion. When combined, they create a structured trading framework that helps traders filter noise, confirm direction, and manage exits with discipline.
This strategy follows a clear three-step process:
(1) Identify entry signal → (2) Confirm trend alignment → (3) Manage exit and reversal.
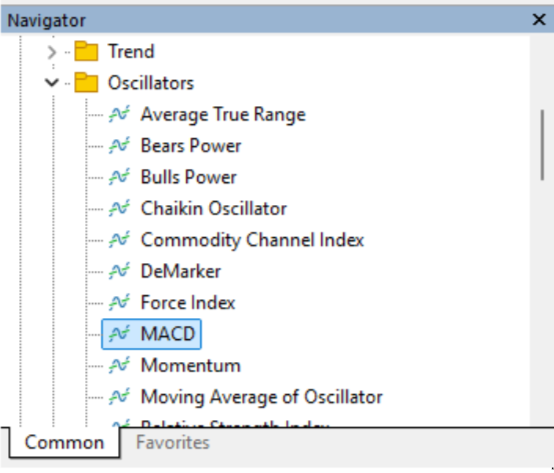
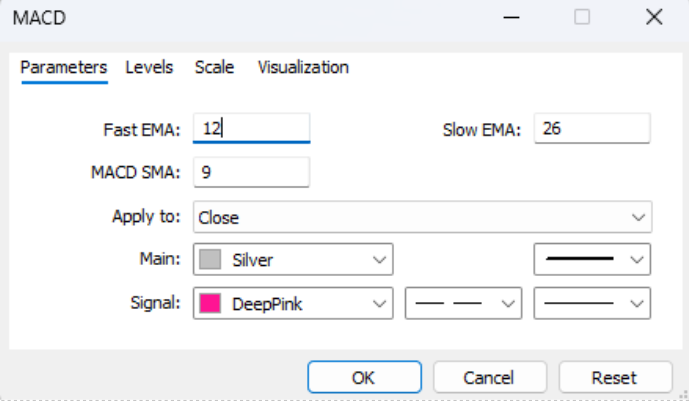
Setting Up on MetaTrader 5
Before trading, set up these indicators on your chart. On MetaTrader 5, you can
- 去 Navigator → Indicators.
- Under Trend, select Exponential Moving Average (EMA).
- Under Oscillators, choose MACD 和 RSI.
You can use default parameters, MACD (12, 26, 9) 和 RSI (14), or adjust them to fit your trading timeframe.
Step 1: Identify Early Momentum with MACD
The approach starts by spotting potential trend changes using the MACD.
Buy signal (left figure): The MACD histogram crosses above the signal line (dash line), supported by the RSI climbing toward but below 50.
Sell signal (right figure): The MACD histogram crosses 以下 the signal line, supported by the RSI declining toward but above 50.
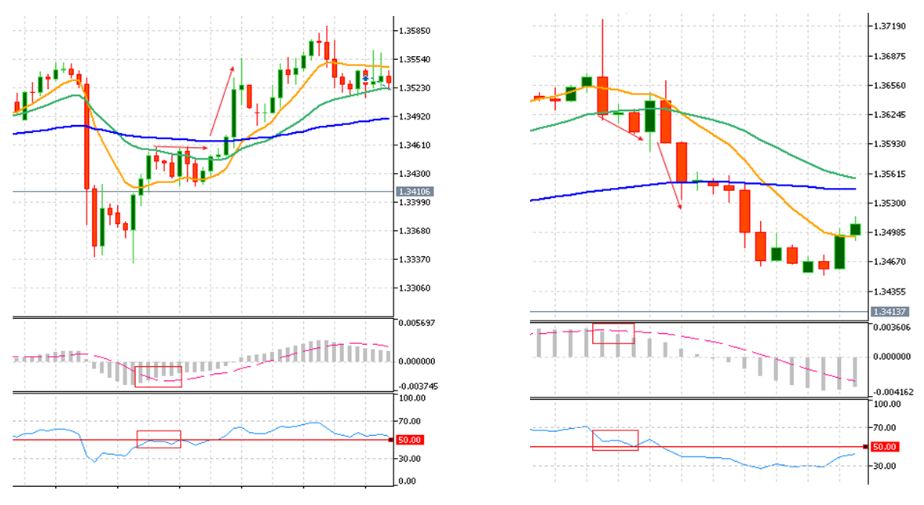
This stage gives traders the initial clue that market momentum start shifting and new trend or swing may be developing.
Step 2: Confirm Trend Direction with EMA
After identifying an entry signal using the MACD and RSI, the next step is to confirm whether the signal aligns with the broader market trend using the Exponential Moving Averages (EMAs).
Short-Term Trend Confirmation
The crossover between the 20 EMA 和 50 EMA helps verify short-term momentum:
- When the 20 EMA (yellow) crosses above 这 50 EMA (green), it signals a developing uptrend.
- When the 20 EMA crosses 以下 这 50 EMA, it indicates a short-term bearish shift.
These crossovers often follow the MACD histogram turning positive or negative, giving an added layer of confirmation that momentum is strengthening in the same direction.
Long-Term Trend Confirmation
这 50 EMA 和 200 EMA define the dominant, long-term bias:
- A 黄金十字 (50 EMA crossing above the 200 EMA) marks sustained bullish momentum.
- A Death Cross (50 EMA crossing 以下 the 200 EMA) suggests an extended downtrend.
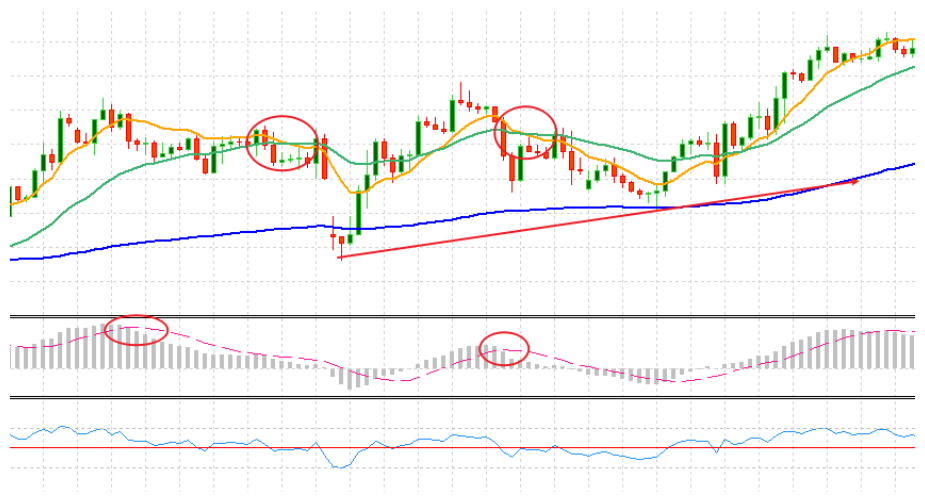
When the 20/50 EMA crossovers occur in the same direction as the 50/200 EMA trend, the signal is far more reliable as below figure shown.
Distinguishing Short vs Long-Term Trends
If only the 20 EMA and 50 EMA cross while the 200 EMA remains flat, it usually reflects a short-term correction within a larger trend.
For example, temporary bearish crossovers may quickly reverse if prices remain above the 200 EMA, confirming that the broader bullish trend is still intact.
Reading Price Behavior Around the 200 EMA
这 200 EMA acts as a “trend boundary” separating bullish and bearish zones:
- 价格 above the 200 EMA → buyers in control; dips toward the line often find support.
- 价格 以下 the 200 EMA → sellers dominate; rallies toward the line often face resistance.
When prices fluctuate repeatedly around the 200 EMA and the MACD histogram narrows, the market is in a consolidation or transition phase. During these periods, traders can tighten stop-losses or take partial profits until a clear breakout confirms direction.
Step 3: Manage Exits and Reversals with RSI
Finally, traders can use the RSI to fine-tune exit timing and monitor potential reversals.
Spotting Exist Opportunities:
If RSI drops below 30, it indicates oversold condition, consider taking profits on short positions.
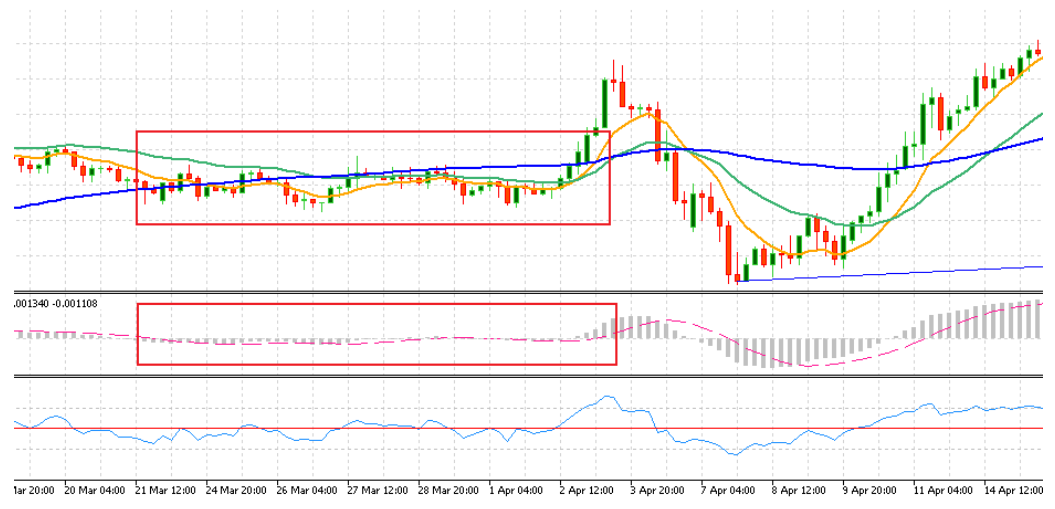
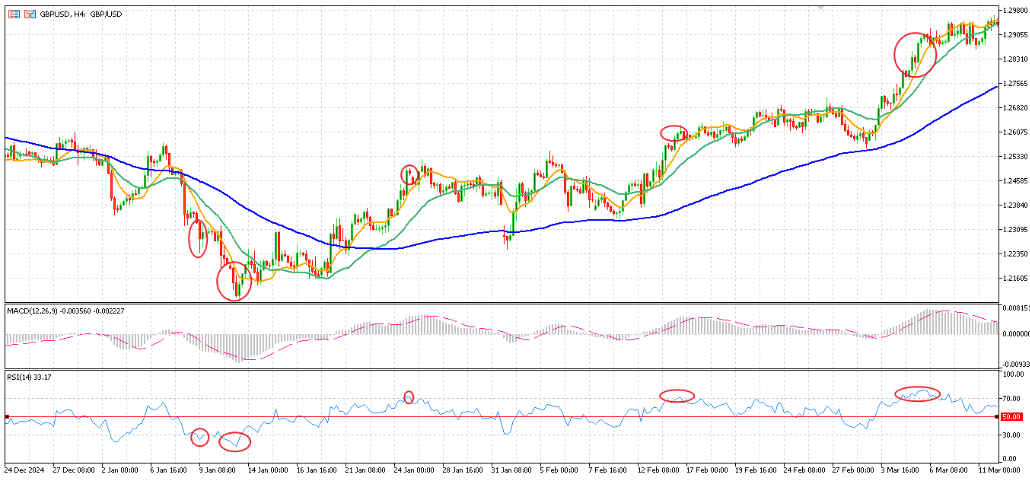
If RSI climbs above 70, it suggests overbought condition, consider taking profit on long positions (as left figure shown).
While the RSI may briefly touch these levels before a trend resumes, closing positions early can protect gains and reduce the risk of reversals.
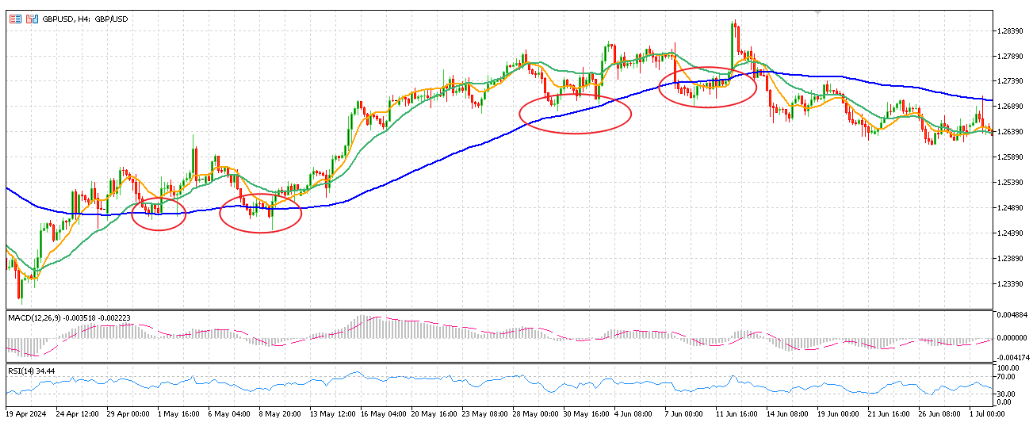
In the figure below, on 9 Jan, RSI briefly dipped below 30 before bearish trend resumed, while from late Jan to Mar in the chart, RSI repeatedly touched 70 as GBPUSD rallied, where each instance signal take-profit chance.
Spotting reversals:
RSI divergence often warns that a trend is losing strength:
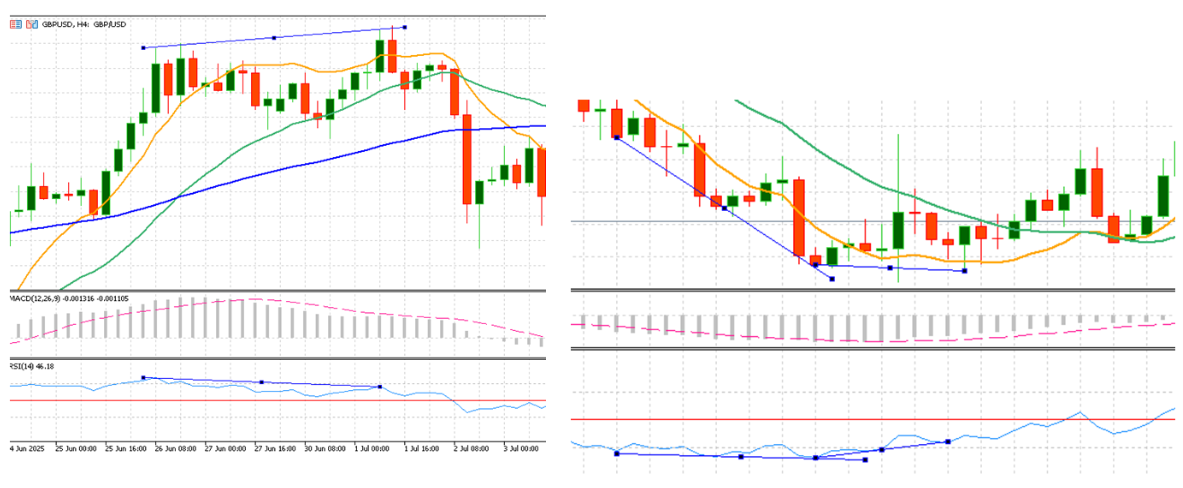
- Bearish Divergence: Prices make new highs, but RSI forms lower highs (as below left figure shown). Momentum weakens, hinting at a possible downward reversal.
- Bullish Divergence: Prices make new lows, but RSI forms higher lows (as below right figure shown). Selling pressure is fading, suggesting a rebound may follow.
Risks of RSI–MACD–EMA Strategies and How to Manage Them
While combining RSI, MACD, and EMA gives traders a structured way to spot momentum and trends, these indicators are not foolproof. Each type carries its own limitations, and managing those risks is crucial for consistent performance.
Risks of Trend and Oscillator Indicators
Trend Indicators (EMA and MACD Line)
Trend indicators like the Exponential Moving Average (EMA) 和 MACD line react only after price movements occur. This lag means signals may appear late, causing traders to enter after a move has begun or exit after a reversal starts. In sideways markets, minor price swings can also trigger repeated EMA or MACD crossovers that don’t develop into real trends, a phenomenon known as whipsawing.
Oscillator Indicators (RSI and MACD Histogram):
Oscillators like the RSI and MACD histogram react more quickly to market changes, helping traders spot early momentum shifts. However, they can also be too sensitive, prone to noise during volatile or range-bound markets.
RSI may signal overbought or oversold too early, while the MACD histogram can flip direction even when the market trend remains unclear. Such quick reversals can easily mislead traders if oscillators are used alone.

Managing Indicator Risks
Here are a few practical ways to make RSI–MACD–EMA signals more reliable:
- Follow RSI-MACD-EMA framework with discipline: Combine oscillator readings with trend indicators to structure entries, holds, and exits more clearly.
- Check multiple timeframes:
Look for signals that align across timeframes (like both 1-hour and 4-hour). If the trends are confirmed on multiple timeframes, it’s usually more reliable.
- Use support, resistance, and price action:
Signals forming near key levels or chart patterns (like trendline bounces or breakouts) tend to carry more weight.
- Adjust settings for volatility:
In a choppy market, traders can lengthen periods of indicators (e.g., RSI 21 instead of 14) to filter out noise. In steady trends, shorter periods help traders react faster.
- Watch momentum and volume:
Signals backed by stronger volume or wider MACD histogram bars usually point to a more sustainable trend.
External Protection – Managing Unforeseen Risks
While the RSI–MACD–EMA framework offers clear entry, exit, and trend signals, it lacks a built-in safeguard against sudden price shocks from unexpected news, flash crashes or liquidity gaps. Because these indicators rely on historical prices, they often react after volatility has already surged, leaving open positions vulnerable to sharp changes.
To protect against these events, traders should combine indicator signals with risk-management tools:
- Hard stop-loss orders placed below key support (for longs) or above resistance (for shorts).
- Trailing stops to secure profits from sudden reversal.
- Additionally, it’s prudent to avoid opening new positions before major economic announcements or high-volatility events.
By integrating these safeguards into the RSI–MACD–EMA framework, traders can preserve capital, manage risk more effectively, and maintain control even when volatility spikes unexpectedly.
Summary of the strategy
| Step | 目标 | Indicator Used | What to Look For |
| 1. Detect Early Momentum to enter trade | Identify when momentum starts to build in a new direction. | MACD (12, 26, 9) and RSI (14) | • MACD histogram crosses above (bullish) or below (bearish) signal line.
• RSI stays below and closer to 50 for long and above and closer to 50 for short |
| 2. Confirm Trend Direction | Confirm whether the trend maintains and whether the move aligns with the longer trend. | 20, 50 and 200 EMAs and MACD Histogram | • 20 EMA crossing above 50 EMA → short-term bull.
• 20 EMA crossing below 50 EMA → short-term bear. • Candles above 200 EMA → uptrend. • Candles below 200 EMA→ downtrend. • Candles around 200 EMA and small MACD histogram bars → uncertain trend |
| 3. Manage Exit & Reversal | Lock in profits and identify fading momentum. | RSI (14) | • RSI above 70 → overbought (time to exit longs).
• RSI below 30 → oversold (time to exit shorts). • RSI diverges from price → potential trend reversal. |
| Bonus Tip | Maintain discipline and confirm with multiple signals. | All 3 Indicators Together | When MACD crossover, EMA trend, and RSI position align, probability of success increases. |
Conclusion
In the fast-moving Forex market, combining RSI, MACD, and EMA gives traders a clear and disciplined framework to identify entries, confirm trends, and manage exits more confidently. While no strategy can guarantee profits, this approach helps filter market noise, improve consistency, and strengthen decision-making when paired with sound risk management.
With 的相关, traders can easily apply this framework using built-in indicators, custom charting tools and expert advisor bots.
Open a 今天即可免费获得模拟账户 to practise risk-free, and when ready, experience real trading and open a live account.