CN
CN  EN
EN 
This edition of Japan 2+2 looks at two more parts of Japan’s market. FANUC and a robotics-focused ETF are two ways to follow the “physical AI” theme, meaning AI put to work in machines and factories, along with the recovery in factory investment. Tokyo Electron and a broad technology ETF are two ways to look at Japan’s role in the global chip-equipment cycle.
In this edition:
FANUC Corp (TSE: 6954)
WHY IT IS IN FOCUS
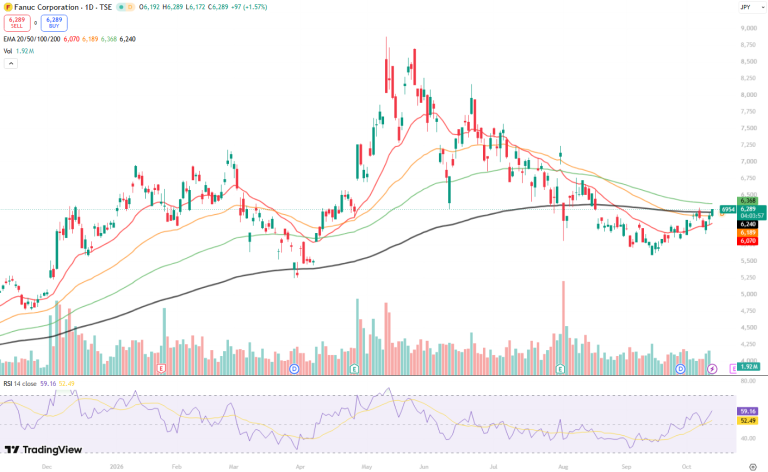
A global leader in factory-automation controls (CNC), industrial robots and robomachines. Orders are now growing about twice as fast as sales. The stock is still recovering from a 19% one-day drop on 3 Aug, even though the company raised guidance that day.
WHAT TO MONITOR
- Whether orders hold up: Q1 orders were ¥281.9bn (+36.9%), and management said it can’t predict whether that level will continue
- FA orders up 63.8%: real demand, or customers ordering early because component lead times are long?
- China (30% of sales, +30% YoY): EV and data-centre demand
- Rising component costs and US tariffs against the 23.2% operating margin
- FX: Q1 averaged ¥159.49/USD, versus ¥144.59 a year earlier
BULL CONSIDERATIONS
Q1 FY26 sales were ¥231.0bn (+17.7%) and net income ¥51.0bn (+34.7%); EPS rose to ¥54.63 from ¥40.56
All four segments grew: Robot ¥96.1bn (+18.7%), FA ¥57.4bn (+15.5%), Robomachine ¥41.7bn (+22.8%), Service ¥35.9bn (+13.0%)
Operating margin rose 1.6 points to 23.2%; gross margin rose to 39.4% from 39.0%
Full-year net income guidance was raised from ¥184.9bn to ¥198bn (+18.9%), and sales guidance of ¥948.1bn would be a record
BEAR CONSIDERATIONS
- The upgraded profit forecast only roughly matched what analysts expected, so it wasn’t a real surprise
- Some Q1 orders may be early ordering that won’t repeat in later quarters
- Part of the margin gain came from the weaker yen and would reverse if the yen strengthens
- China at 30% of sales makes the company sensitive to China’s investment cycle
KEY DATA
SHARE PRICE / MARKET CAP ¥6,186 · ~¥5.8trn Close on 5 Oct 2026; equity ratio of 89.7%. | Q1 FY26 (APR-JUN) ¥231.0bn, +17.7% Operating profit ¥53.5bn (+26.1%); net income ¥51.0bn (+34.7%). | FY3/27 GUIDANCE ¥198bn NI, +18.9% Sales ¥948.1bn (+10.5%), a record; operating profit ¥218bn (+18.6%). |
ORDERS ¥281.9bn, +36.9% Orders are running ahead of sales; FA orders +63.8%. | LAST REPORTED YEAR ¥857.8bn sales FY3/26 actual; the base for this year’s +10.5% guidance. | NEXT CATALYST H1 results, late Oct 2026 Watch whether orders stay ahead of sales. |
Tokyo Electron Ltd (TSE: 8035)
WHY IT IS IN FOCUS
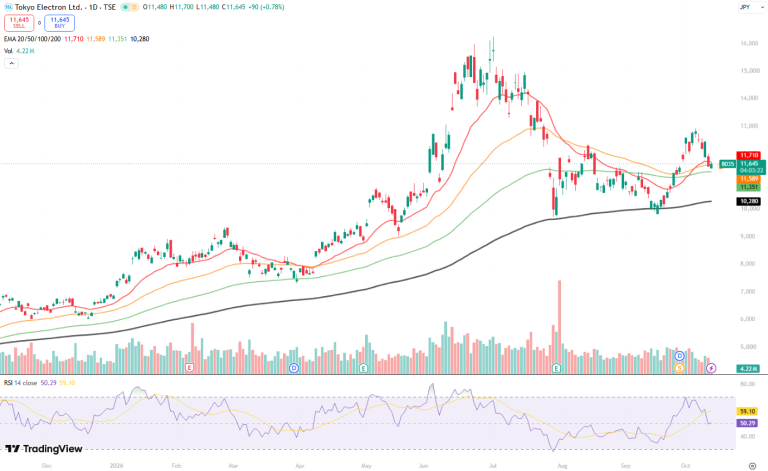
Japan’s largest maker of wafer-fab equipment, the machines used to make chips. Q1 sales and gross profit were records, and management raised its forecast for the global chip-equipment market through 2027 because of AI-driven demand. A 5-for-1 share split took effect on 1 Oct and cut the minimum 100-share purchase to about ¥1.27m.
WHAT TO MONITOR
- Chip-equipment market forecasts: $150bn+ for CY2026 and $190bn+ for CY2027
- Equipment sales mix: DRAM 32%, non-volatile memory 11% (+32% QoQ), other chips 57%
- China at 30.4% of sales (+3.6 points QoQ), which carries export-control risk
- Progress toward the 50% gross-margin target as price increases take effect in Q4
- First full-year guidance, due with Q2 results
BULL CONSIDERATIONS
- Q1 FY3/27 sales were ¥732.3bn (+33.3%), operating income ¥211.4bn (+46.1%) and net income ¥164.3bn (+39.5%)
- Quarterly sales have climbed from ¥549.5bn to ¥630.0bn, ¥552.0bn, ¥711.8bn and now ¥732.3bn
- Operating margin rose to 28.9% from 26.3%; annualised ROE was 30.7%
- H1 guidance was raised to ¥1.62trn sales (+37.3%) and ¥458bn operating income (+51.1%), both records
BEAR CONSIDERATIONS
- Net income fell 23.3% QoQ because the previous quarter included a one-off gain from selling shareholdings
- Q1 alone delivered 45.2% of the H1 sales guidance, so a lot of good news is already in the forecast
- About 30% of sales go to China, which is exposed to geopolitics and export controls
- Capex fell 24.4% YoY to ¥39.9bn, so watch whether capacity keeps up with demand
KEY DATA
SHARE PRICE / MARKET CAP ¥12,080 · ¥27.4trn 2 Oct 2026; about US$174bn after the 5-for-1 split. | Q1 FY3/27 (APR-JUN) ¥732.3bn, +33.3% Operating income ¥211.4bn (+46.1%); gross margin 46.8%. | H1 FY3/27 GUIDANCE ¥1.62trn sales, +37.3% Net income ¥349bn; EPS ¥767.51 before the split, about ¥153.5 after. |
SHAREHOLDER RETURNS Interim DPS ¥384 (record) About ¥76.8 after the split; payout policy of 50%. | BALANCE SHEET / CASH Equity ratio 71.7% Q1 free cash flow ¥80.5bn; cash ¥409.6bn. | NEXT CATALYST Q2 results, with the first full-year guidance Watch the Q2 new-equipment sales target of over ¥700bn. |
Global X Japan Robotics & AI ETF (TSE: 2638)
WHY IT IS IN FOCUS
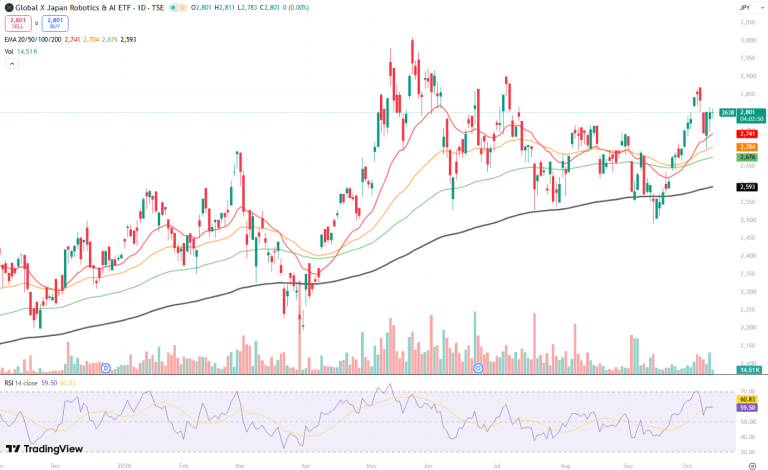
A diversified route to Japan’s factory-automation and robotics leaders, positioned around the physical AI theme.
WHAT TO MONITOR
- FANUC’s order trend: FANUC is about 7.8% of the fund, and its Q1 orders rose 36.9%
- Q2 orders at the other top holdings: SMC, Keyence, Yaskawa, Daifuku
- How the fund performs against semiconductor-focused ETFs
- Price versus iNAV before you place an order
- Distribution at the 24 Dec record date
BULL CONSIDERATIONS
- Top holdings are evenly weighted: Fuji 8.9%, SMC 8.1%, Omron 8.0%, FANUC 7.8%, Keyence 7.8%
- A cleaner way to play China’s factory-investment recovery, which FANUC’s results show spreading (China sales +30%)
- Momentum is building: NAV +22.5% over 6 months and +8.3% over 1 month
- About ¥15bn in AUM supports reasonable liquidity
BEAR CONSIDERATIONS
- Only +26.0% since its June 2021 launch, far behind 2854’s +201% since 2022
- NAV −1.0% over 3 months: the theme has been choppy
- The 0.649% fee is more than double 2854’s 0.3025%
- Very little income: 12-month trailing yield of 0.14%
KEY DATA
FUND SIZE / INCEPTION ¥15.1bn · 21 Jun 2021 NAV ¥285,014 per 100 units at 6 Oct. | TOTAL EXPENSE RATIO 0.649% p.a. 0.59% before tax; record dates 24 Jun and 24 Dec.
| HOLDINGS Top 10 ≈ 77.2% Fuji, SMC, Omron, FANUC, Keyence, Daifuku, Yaskawa, THK, Nabtesco, CyberAgent.
|
FANUC WEIGHT 7.8% FANUC is also one of the fund’s top-five positions
| PERFORMANCE 29.3x PER · 0.56% 1 month +8.3%; 3 months −1.0%; +26.0% since launch.
| NEXT CATALYST Holdings’ H1 results, late Oct to Nov FANUC’s order trend is the best guide for the basket.
|
Global X Japan Tech Top 20 ETF (TSE: 2854)
WHY IT IS IN FOCUS
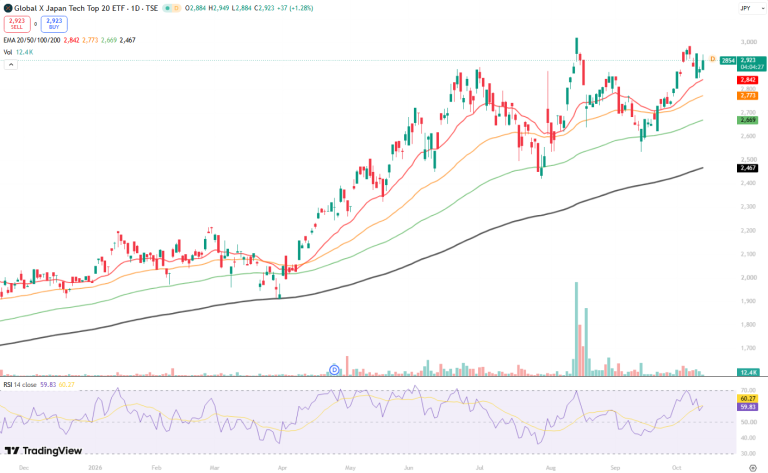
A low-cost, liquid way to own 20 large Japanese tech companies, with direct exposure to the chip-equipment cycle.
WHAT TO MONITOR
- Tokyo Electron and Advantest Q2 results: together they are about 19% of the fund
- Recruit (13.4%), the largest holding and not a chip company
- Distribution at the 24 Oct record date
- Price close to the top of its 52-week range (¥3,020)
- Bid-ask spread of about 0.34%; use limit orders
BULL CONSIDERATIONS
- NAV +201.2% since its June 2022 launch, +35.7% over 6 months and +10.1% over 3 months
- Its biggest chip holdings are growing fast: TEL’s Q1 operating income was +46.1%, and the chip-equipment market is forecast at $190bn+ for 2027
- Spread beyond chips: technology 63%, communication services 24%, industrials 11%
- Low fee of 0.3025%, about half of most Global X thematic funds
BEAR CONSIDERATIONS
- Top 10 are 77.7% of the fund, so it is less diversified than “20 names” suggests
- About 33.5x earnings, a growth-stock valuation
- 52-week range of ¥1,854–3,020: expect wide swings
- Heavily exposed to the chip-equipment cycle through Advantest and TEL
KEY DATA
| SHARE PRICE / FUND SIZE ¥2,950 · ¥17.5bn AUM and NAV of ¥285,644 per 100 units at 31 Aug 2026. | TOTAL EXPENSE RATIO 0.3025% p.a. 0.275% before tax; record dates 24 Apr and 24 Oct. | HOLDINGS 20 names · top 10 ≈ 77.7%
Recruit 13.4%, Sony 9.8%, Advantest 9.6%, Keyence 9.5%, Tokyo Electron 9.4%. |
PERFORMANCE +201.2% since launch 6 months +35.7%; 3 months +10.1%; 1 month +8.2%. | VALUATION / YIELD ~33.5x P/E · 0.62% Latest distribution ¥900 per 100 units (April 2026). | NEXT CATALYST Distribution at the 24 Oct record date Followed by Q2 results from its largest holdings. |
Japan in Focus
Continue exploring the themes shaping Japan’s markets with Japan in Focus, where you’ll find our latest bi-weekly breakdowns of two stocks and two ETFs, alongside past editions.
When you’re ready to put your research into action, explore Japanese stocks and ETFs on NOVA, with free market data and no platform fee.
Ready to explore the Japan market?
Receive SGD 10* for your first Japanese stock · ETF trade on NOVA.
🔴 Receive a SGD 10* first-trade credit
从 1 October – 31 December 2026, place your first trade in any Tokyo Stock Exchange (TSE) listed stock or ETF on NOVA to receive a SGD 10 trading credit.
🔴 <October exclusive> Receive an additional SGD 20* bonus
Place at least 1 buy trade in both November and December 2026 to receive an additional SGD 20 trading credit.