By Pranay Yadav, Portfolio Analyst, Mint Finance
Rising bond yields and an unexpected economic slowdown in Japan pose new risks to the Nikkei 225, following its recovery from the tariff-driven decline.
Warning lights are flashing. Downside risk potential is present. Nikkei 225 is trading near its one-year average where it has previously shown a tendency to revert.
What could help an investor hedgethe uncertainty in the Nikkei 225?
IMPACT OF RISING JGB YIELDS ON NIKKEI 225
Japan’s bond market witnessed renewed turmoil this spring, with a feeble 20-year auction pushing long-term yields to record highs. The 30-year JGB yield has hit an all-time high.
Chart 1: JGB yields soar, fueled by tightening expectations and inflation pressures.
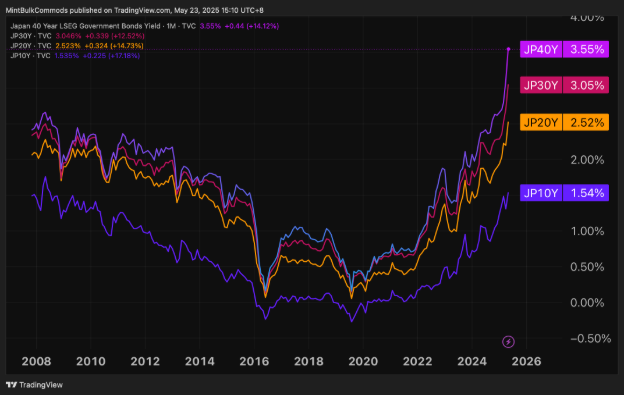
来源: TradingView as of 23 May 2025
Rising yields pose potential risks for the Nikkei 225. Higher yields pressure the earnings-yield gap, eroding equity risk premium. In layman terms, when bond yields go up, investors will opt for the safety of higher bond returns instead of paying for equity risk premium.
Additionally, higher yields tighten financial conditions, raise borrowing costs and squeeze corporate profits, potentially weighing down on Nikkei 225.
Chart 2: 52-week correlation between JGB yields & Nikkei 225 has turned negative
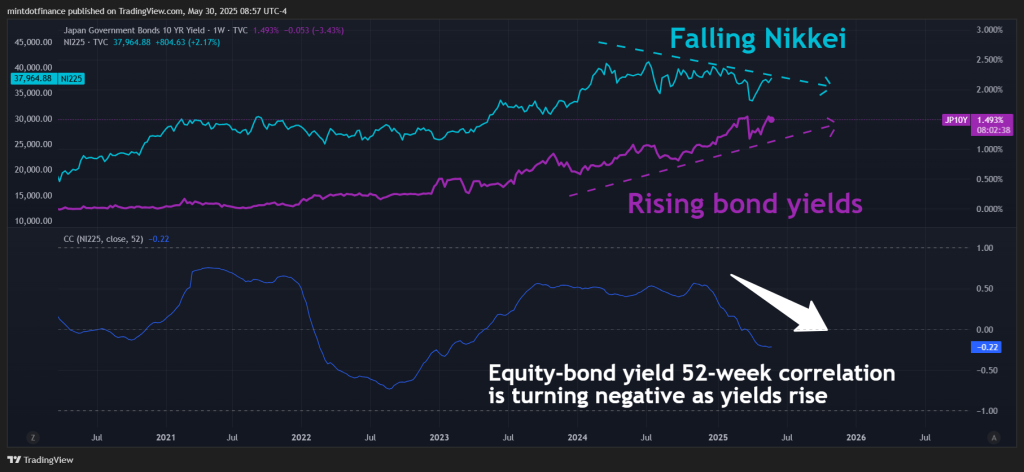
来源: TradingView as of 30 May 2025
As bond prices tank to decade lows and the yield curve steepens significantly, markets are increasingly vulnerable to disruption from carry trade unwinding.
Chart 3: BoJ policy shift shocked the market last August, driving sharp adverse moves.
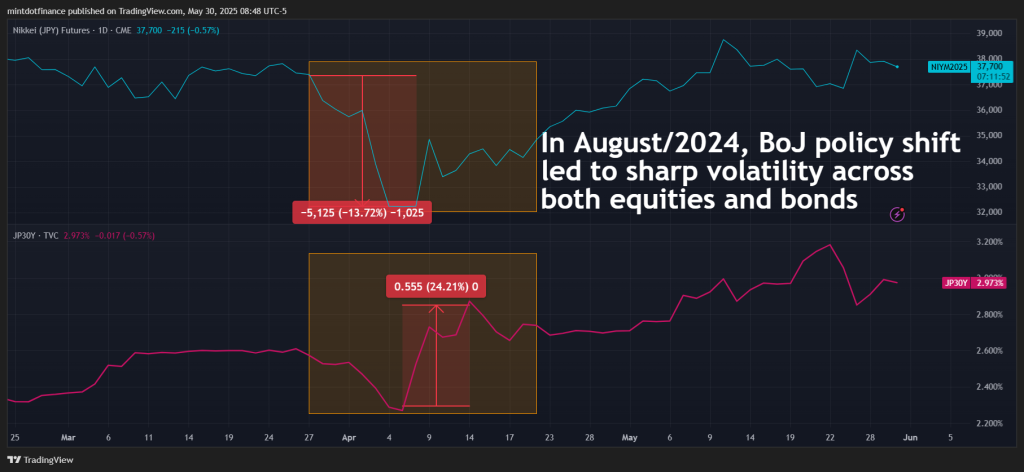
来源: TradingView as of 30 May 2025
Historically, volatility in the bond market has often spilled into equities. Past 30Y JGB spikes tended to be succeeded by sharp Nikkei 225 drops. Will history repeat itself?
Chart 4: Historically, JGB volatility spikes have triggered equity volatility.
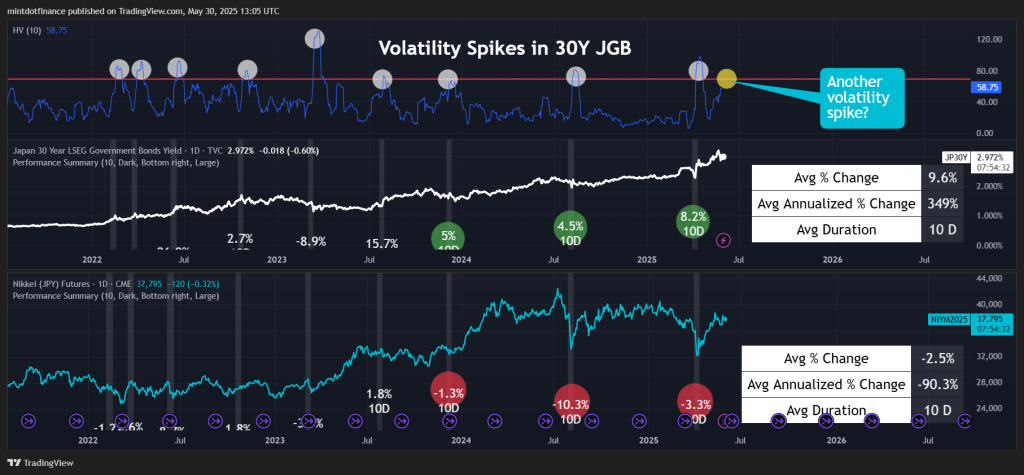
来源: TradingView as of 30 May 2025
Monetary policy uncertainty & fragile global trade have pushed JGB into turmoil. The GDP contraction in Q1 is an additional factor which will potentially force a shift in BoJ’s policy path. Slowing growth weighs down on the equities through weaker domestic demand.
BoJ’s situation could get complicated due to slowing GDP and rising inflation which may push Japan towards stagflation.
Chart 5: Japan’s economy shrank in Q1 amid disruptive tariff impact.
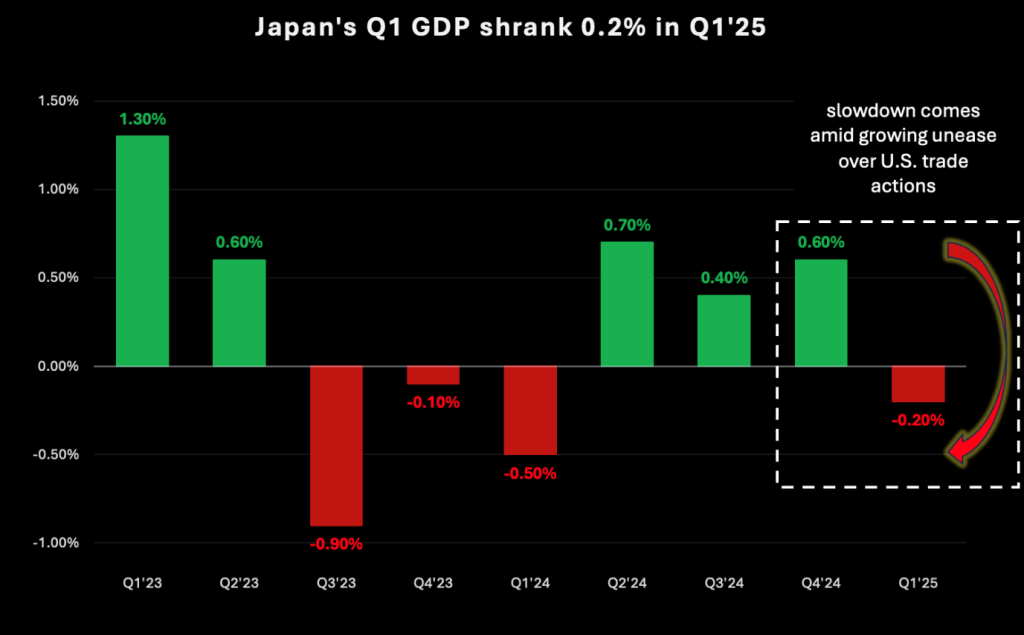
来源: Trading Economics as of 29 May 2025
NIKKEI TRADING AT LONG-TERM MEAN
The Nikkei 225 is trading at its long-term average and over the past year the index has shown strong mean reversion around this level, speaking volume about the need for understanding the market dynamics, economic conditions, and the specific characteristics of the Nikkei 225.
Chart 6: Mean reversion in Nikkei 225 over the past year
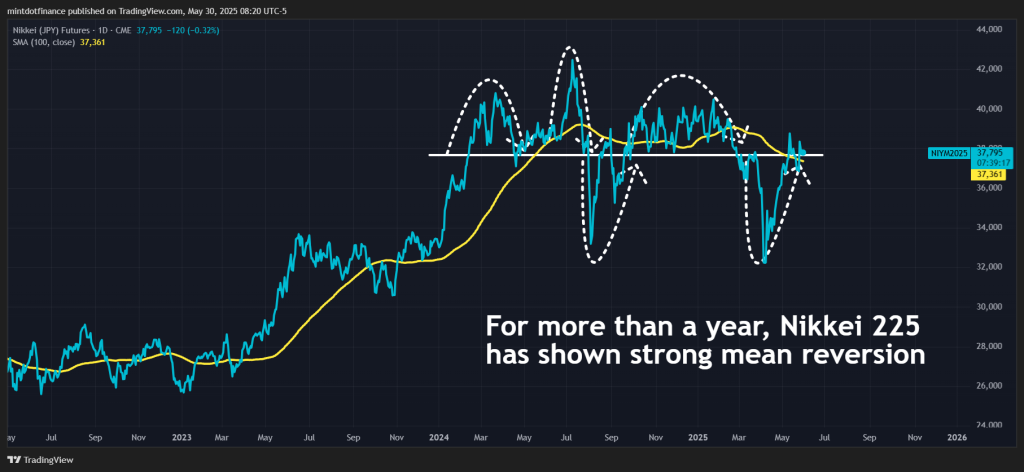
来源: TradingView as of 30 May 2025
While past trading levels suggest more upside for a short positioning, a sharp decline may occur if a major risk event unfolds.
Chart 7: Nikkei 225 technical indicators signal contrasting views.
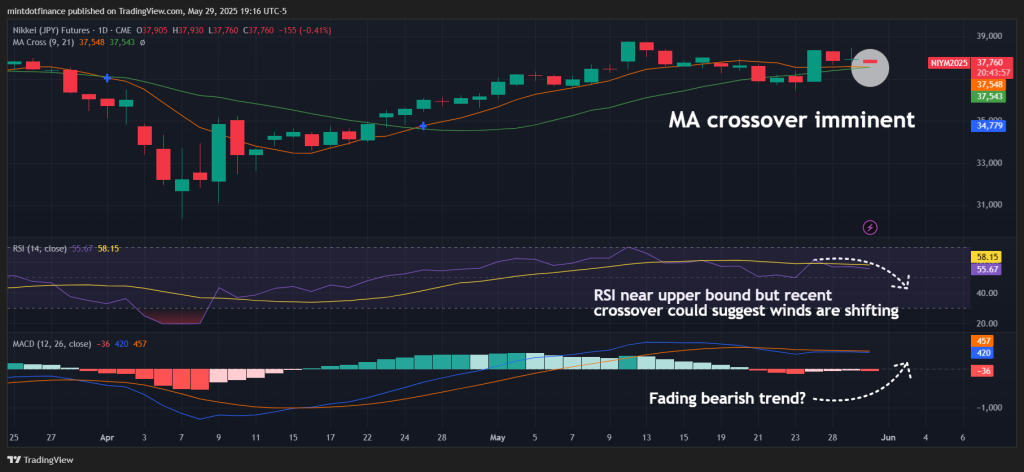
来源: TradingView as of 29 May 2025
A bearish MA crossover is imminent which could suggest near term downside. Although, MACD signals that the recent bearish trend may be fading.
CONCLUSION AND CASE STUDIES
Risk signals are flashing with spiking JGB yields and slipping GDP. As Nikkei 225 trades near its long-term average, risks of mean reversion mount.
Chart 8: Hypothetical short position in CME Micro Nikkei-225 (Yen) futures expiring in September
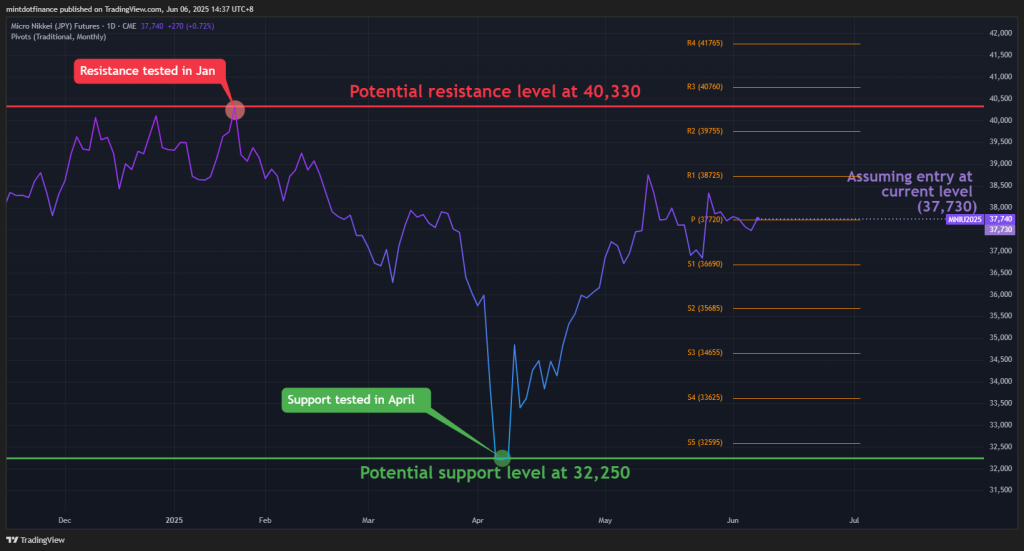
来源: TradingView as of 6 June 2025
If an investor believes that these risks could materialize and that the Nikkei 225 could decline, they may consider shorting the CME Micro Nikkei 225 (Yen) futures. In this case, the yen-denominated Micro Nikkei Futures contract could further enhance the profit in USD due to the anticipated strengthening of the yen.
The investor should manage downside risk by placing a stop-loss. Based on Chart 8, one option is to set it just above the Jan high of 40,330, a potential resistance level, which would represent a maximum hypothetical loss of JPY 130,000 ((37,730 – 40,330) × 50 yen/contract). Investors with a lower risk tolerance may choose a closer stop-loss.
If the Nikkei 225 pulls back to around 32,250, a support level observed in mid-April, this hypothetical short position could yield JPY 274,000 ((37,730 – 32,250) × 50 yen/contract). However, market movements are unpredictable, and there is no guarantee that the index will reach this level before the futures contract expires.
|
ENTRY |
IF NIKKEI 225 FALLS |
STOP LOSS |
POTENTIAL GAINS (JPY) |
POTENTIAL LOSSES (JPY) |
|
37,730 |
32,250 |
40,330 |
JPY 274,000 ((37,730 – 32,250) x 50 yen/contract) |
JPY 130,000 ((37,730 – 40,330) x 50 yen/contract) |
Conversely, investors who remain optimistic that risks highlighted above will not materialize in the near-term, may consider taking a long position in the Nikkei 225 as demonstrated in chart 9.
Chart 9: Hypothetical long position in CME Micro Nikkei-225 (Yen) futures expiring in September
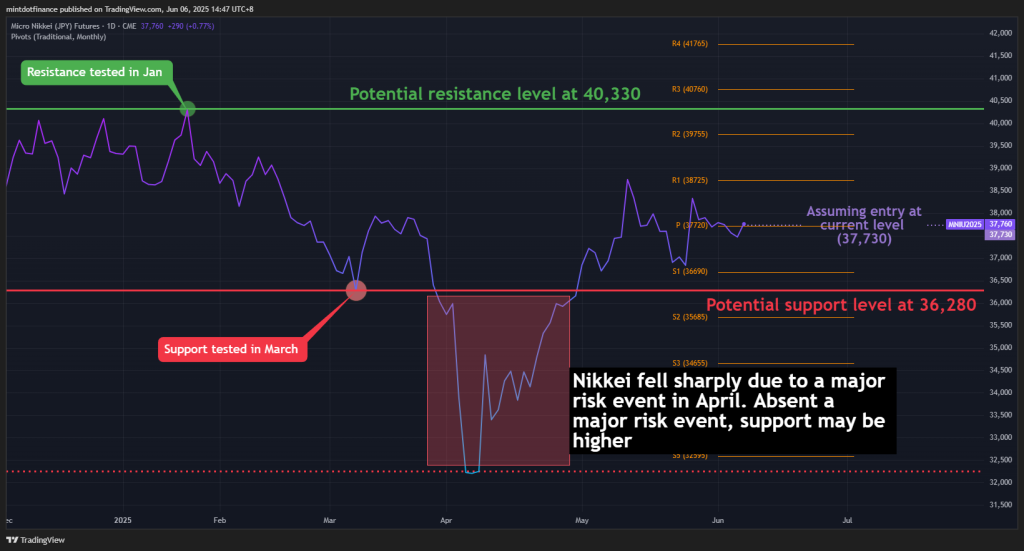
来源: TradingView as of 06 June 2025
The investor could consider placing a stop-loss at the support level of 36,280, which was tested in March, based on Chart 9. This would represent a maximum hypothetical loss of JPY 72,500 ((36,280 – 37,730) × 50 yen/contract).
Assuming Nikkei 225 rises to 40,330, the previous high set in February, the hypothetical long position could yield JPY 130,000 ((40,330 – 37,730) × 50 yen/contract).
|
ENTRY |
IF NIKKEI 225 RISES |
STOP LOSS |
POTENTIAL GAINS (JPY) |
POTENTIAL LOSSES (JPY) |
|
37,730 |
40,330 |
36,280 |
JPY 130,000 ((40,330 – 37,730) x 50 yen/contract) |
JPY 72,500 ((36,280 – 37,730) x 50 yen/contract) |
Directional views on the Nikkei 225 come with inevitable uncertainty. Investors can opt for spread positions to reduce it.
A spread comprising a long position in the Nikkei 225 and a short position in the S&P 500 allows investors to maintain a bullish view on the Nikkei 225 while stay hedged against a potential drawdown through the short S&P 500 position.
We covered the hypothetical spread trade in detail in a previous paper. In brief, this spread trade helps the traders seize opportunities in the relative outperformance of Japan equities due to capital flows to Japan while remain insulated in case of a drawdown.
Foreign funds have been net buyers of Japanese stocks for seven weeks in a row as of May 2025.
Chart 10: Net weekly foreign investment in Japan stocks continues to ramp up
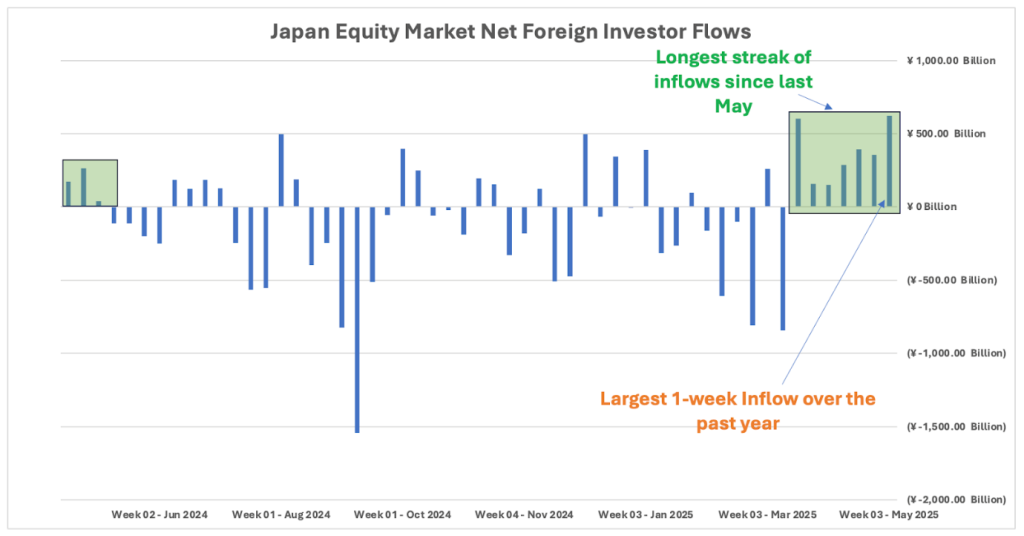
来源: TSE as of 29 May 2025
Chart 11: Hypothetical spread between CME Nikkei-225 (USD) and CME E-mini S&P 500 expiring in September
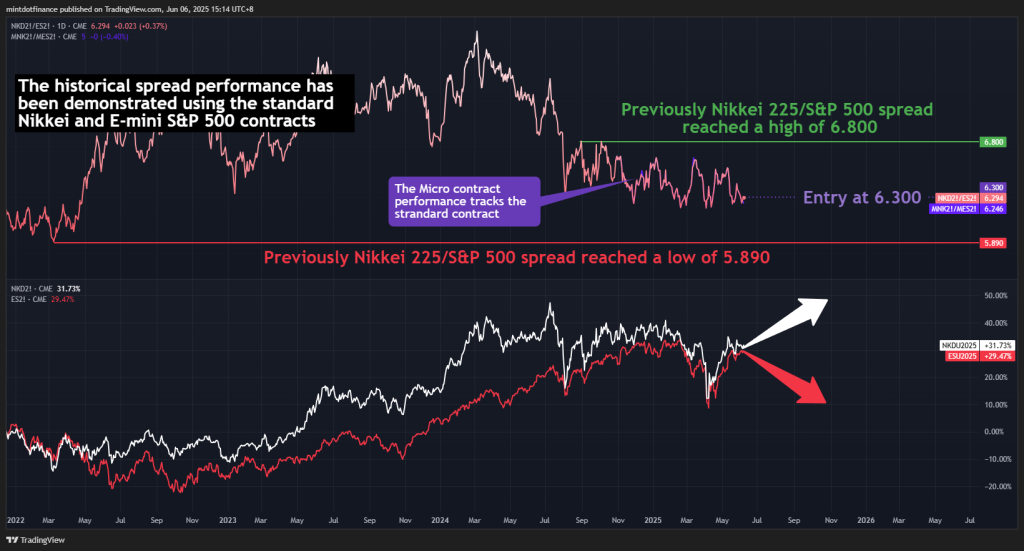
来源: TradingView as of 6 June 2025
Investors can deploy CME Micro E-mini S&P 500 futures alongside CME Micro Nikkei 225 (USD) futures to express this view. Alternatively, the standard E-mini S&P 500 and Nikkei 225 (USD) contracts can also be deployed.
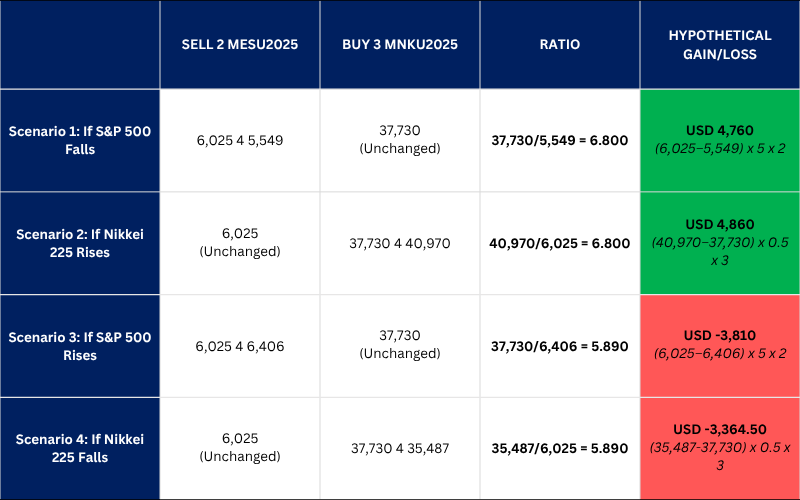
A position consisting of 3 x MNKU2025 ($56,595 = 3 x 0.50 x 37,730) in notional) and 2 x MESU2025 ($60,250 = 2 x 5 x 6,025) in notional) roughly balances notional on both legs, allowing for a purely relative outperformance-based trade.
In this hypothetical trade-setup, the Micro Nikkei 225 (USD) contract is used to maintain P&L on both legs in the same currency, simplifying spread execution.
Looking at Chart 11, the Nikkei 225/S&P 500 ratio previously reached a high of 6.800 last July before retracing. If an investor exits at that level, the potential gain could range from $4,760 to $4,860, as outlined below.
To manage risk, the investor could set a stop-loss at the bottom of the spread range which hit a low of 5.890 in early 2022. This would imply a potential loss between $3,364.5 and $3,810.
For now, Sayonara!
Micro Nikkei 225 (USD) and Micro E-mini S&P 500 spread tracks the performance of the standard contract spread.
Trade Nikkei 225 Futures from 10 Cents/Lot*

Trade Nikkei 225 Futures from just 10 cents/lot. Learn more 立即开户。 and access this low-cost opportunity to start trading CME Micro Nikkei 225 with ease.
The author’s views are independent and do not represent that of Phillip Nova. For applicable terms and conditions and a full risk disclaimer, please refer to www.phillipnova.com.sg. This advertisement has not been reviewed by the Monetary Authority of Singapore.
Trade CFDs, ETFs, Forex, Futures, Options, Precious Metals, and Stocks on NOVA
Features of trading on NOVA
- 访问 20 多个全球交易所
从 20 多个全球交易所的 200 多个全球期货中捕捉机会 - 全球股票的交易机会
Over 11,000 Stocks and ETFs across Singapore, US, China, Hong Kong, Malaysia and Japan markets. - Charting Powered by TradingView
View live charts and gain access to over 100 technical indicators - True Multi-Asset Trading
Trade CFDs, ETFs, Forex, Futures, Options, Precious Metals and Stocks on a single ledger on NOVA - USD Shares Margin Rate at Only 4.5% p.a
- Fractional Shares from US$1