Gold’s journey since 2025 has been nothing short of remarkable. What began as a steady uptrend in 2024 accelerated through 2025 into a full-blown bull market. Prices more than doubled from under $2,000 per ounce just two years ago to breaking past the $4,000 mark for the first time in October 2025 as macro uncertainty intensified and central banks stepped up accumulation.
The drivers behind this move were classic. Persistent inflation pressures, slowing global growth, and the growing expectation of monetary easing from the Federal Reserve, as reduced real yields lifted the appeal of non-yielding assets like Gold. Central banks in emerging markets and reserve managers embraced gold as a key diversification tool, tightening available supply and anchoring demand.
Additionally, by the end of 2025, the pace of inflows into gold exchange-traded funds and physical bars hit record levels. ETF vehicles saw record inflows in January 2026, particularly from Asia, pushing total global gold ETF assets under management to unprecedented highs, even as prices became more volatile.
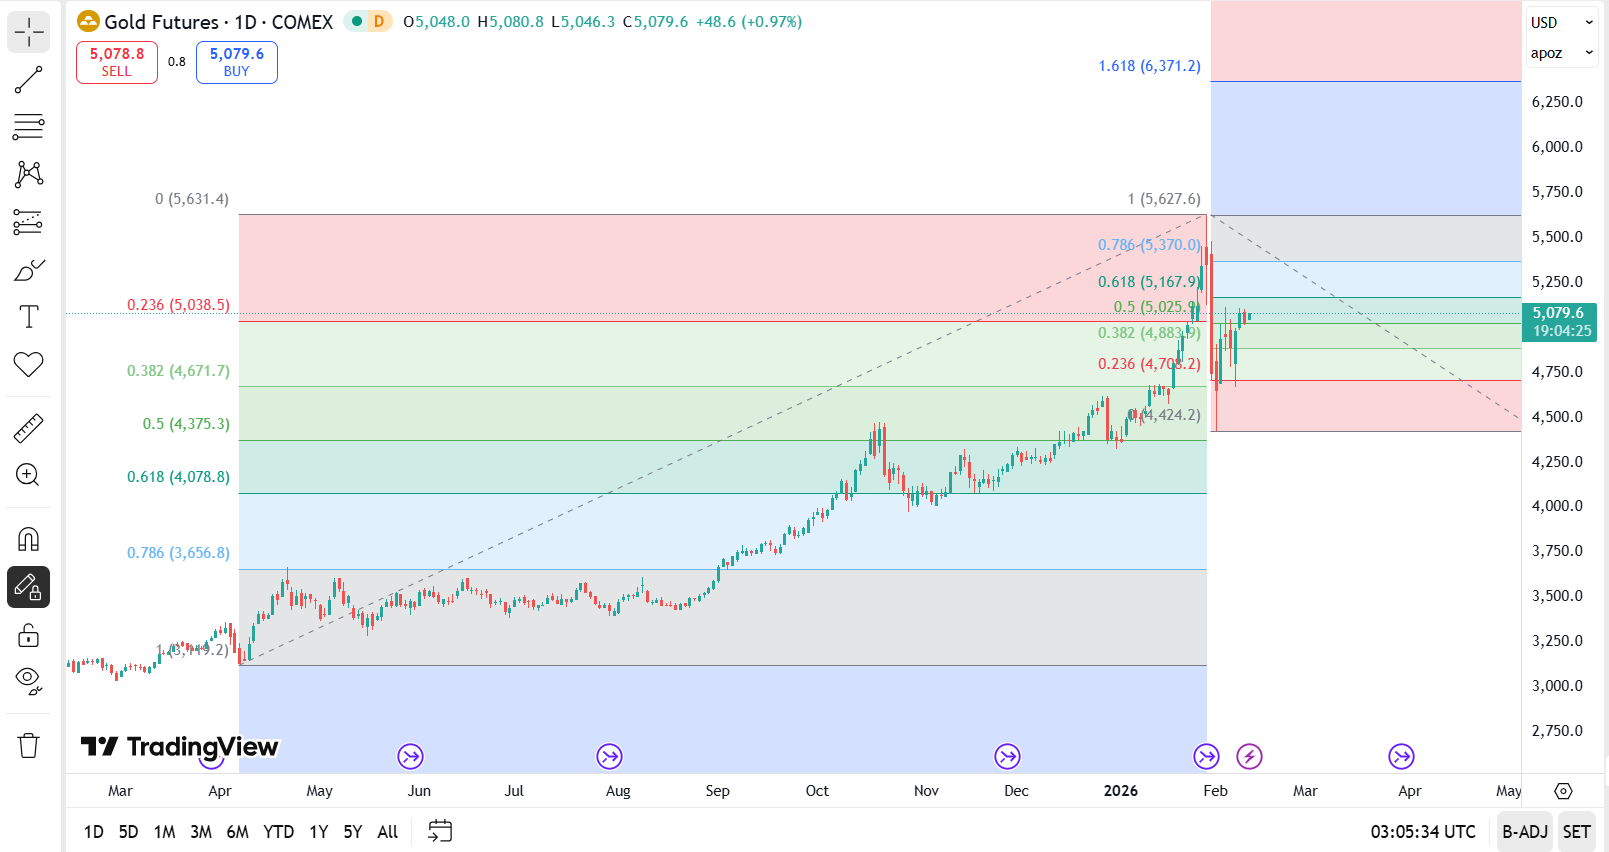
In early 2026, we’ve seen both the defining strength and characteristic volatility of this bull phase. Gold briefly climbed above $5,600 per ounce late January, only to give up some ground as markets reacted to shifting risk sentiment. However, over the past week, there’s been a mild pullback and consolidation after a two-day positive run was snapped, reflecting easing geopolitical tensions and profit-taking as sentiments shifted toward risky assets. Yet, analysts note that central bank demand continues to underpin prices, keeping a floor under gold and preventing deeper corrective declines.
From a fundamental perspective, the story hasn’t changed; interest rate expectations continue to remain critical. Lower short-term rates, or even just the expectation of cuts, reduce the opportunity cost for holding gold and support higher valuations. Major institutions have repeatedly cited this as a core driver of their bullish outlooks. Inflation uncertainty and fiscal stress in large economies continue to nudge investors toward real assets. Central banks aren’t slowing down either. Official purchases have remained robust, especially from Asia and Eastern Europe, and this structural demand has given gold a fundamentally stronger base than in past cycles.
Technically, gold’s charts reflect this tug-of-war between strong underlying demand and short-term profit taking. After a rapid rally into early 2026, price action has swung between breakouts and pullbacks. Consolidation around key levels suggests the market is finding a new base before committing to the next direction. Alongside classic support and resistance zones, momentum indicators are telling us to respect both the strength of the trend and the risk of sharp corrections.
Looking ahead, the analyst consensus is bullish, but broad in scope. While some feel that the $6000 mark is plausible by the end of 2026, and we do not deny the plausibility, but after such relentless linear price action in Gold, some breather is also cautioned. Consolidation between a broad range of $4,000–$5,000, price level well above historical norms, would further strengthen the bull-run case for Gold and should be considered a healthy sign of market dynamics.
For investors, this means staying grounded in both the fundamentals and the technical signals. Gold is not trading in a vacuum: nominal rates, real yields, currency trends, and geopolitical headlines will continue to move price rapidly and investors are strongly advised to brace for two-way price action rather than one-way linear moves seen last year. Overall, the broad backdrop of elevated risk premiums, central bank appetite, and macro uncertainty still favours gold’s appeal.
In a nutshell the rally of the past year was powerful, and although we’ve shifted into a phase with pullbacks and consolidation, the structural forces behind gold remain supportive. For those watching trends, the key is to separate short-term noise from longer-term direction, and to remember that in bull markets like this, pauses often set the stage for the next advance.

Take a view on COMEX Micro Gold and Silver Futures now. 立即了解详情!
Or take a view on precious metals via ETFs, mining Stocks and Forex now!
在 NOVA 交易 CFDs、ETF、外汇、期货、期权、贵金属和股票
NOVA 交易功能
- 接通超过 20 个全球交易所 通过超过 20 个全球交易所的 200 多个环球期货产品,把握市场机会。
- 全球股票交易机会 覆盖新加坡、美国、中国、香港、马来西亚及日本市场超过 11,000 只股票和 ETF。
- TradingView 图表支持 查看实时图表,并使用超过 100 种技术指标。
- 真正的多资产交易 通过 NOVA 的单一账簿,交易 CFDs、ETF、外汇、期货、期权、贵金属及股票。
- 美元及新元股票融资利率低至 4.5% p.a.
- 美股碎股低至 1 美元起
以低至 1 美元名义金额开始投资美股碎股,每笔订单佣金为 0.38 美元。