After a blazing skyward price movement for the majority of 2022, largely stemming from Russian supply disruptions caused by geopolitical unrest caused by the Ukraine invasion and weather extremities, natural gas futures suddenly collapsed last month. Hope appears to have become an exercise in futility for gas bulls, with 60% of market value erased in 6 weeks. From the highs over $7 per million metric British thermal units or MMBtu, on December 1 the front-month gas contract on the New York Mercantile Exchange’s Henry Hub hit a low of $2.92 this week, lowest since May 2021. The descent has predominantly been attributed to exceptionally warm winters that have led to sufficiently stocked supplies of natural gas in the United States and Euro-Zone.
Natural gas plunged to newer lows breaching the historic support level of $3 MMBtu, on worries that ongoing restrictive monetary policies may orchestrate an economic slowdown and push the world’s largest economy into recession. Despite elevated travel and the re-opening of China, the recent buildup of inventories reported by the U.S. Energy Information Administration (EIA) in the past few weeks, a sign of lower demand, weighed on Natural Gas prices. Natural Gas has fallen 30% since the beginning of 2023, its worst-ever start of the year.
With back to back supports being broken, it is a fair question to ask whether the strategic support of $2.5 MMBtu is next on the horizon. Traders are still in dilemma whether to go long or to remain on the sidelines as they are still full of skepticism after the recent selling in Natural Gas. Gas bulls might have missed the warm signals sent by “king weather” and it is incredible how we had gotten here and so quickly too. The historic plunge in natural gas, from a record high in December 2005 of above $15 MMBtu to achieve a 60% swing-down to around $6 MMBtu by September 2006, took 9 months. Whereas the current drop of 60% from highs near $10 MMBtu in mid-August to $3 MMBtu in January, took just 5.5 months.
Following the bans on Russian supplies came the spree to secure as much supplies as possible as insurance against soaring energy prices before winter kicks in. This strategy seems to have backfired, with the present weather being described as the warmest start to winter in 20 years. Unless the weather does a retake on skeptical winter forecast models, and given the extremely bearish storage report as per a Reuters poll, it is highly likely that the $2.5 MMBtu support will be tested very soon.
Natural gas seems to have tested the extreme downside lows multiple times this week as bears may be looking to offload before being trapped. Meanwhile, bulls might be gearing up for sudden entry opportunities with turning point price movement tied up with fundamentals. In the unlikely event that freezing winds start blowing suddenly in the western part of the globe, we may witness some correction but its “sell on every rise” on the way to $3.287 MMBtu 100-Month Simple Moving Average. A trend line (in green) joining recent lows will act as a resistance while fundamental and technical long-term views seem currently biased for a downside, pricing a dip, even lower.
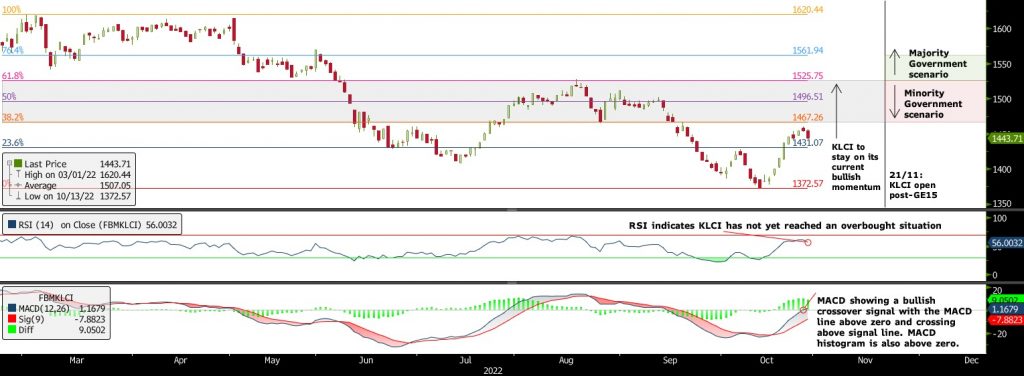
Post-elections, in the scenario that a majority government is formed, we believe the KLCI could move further upwards towards 0.764 Fibonacci level of 1561.94. However, in the alternate scenario that a minority government is formed, we expect market sentiment to fall and the KLCI could move back downwards towards the 0.382 Fibonacci level of 1467.26. Nevertheless, we also note that there is a possibility that similar to GE14, Bursa Malaysia may announce a special holiday and close the KLSE on 21October, the day the KLCI opens post- GE15, to prevent extreme price movements in the stock market in the case of a shock opposition victory.
Trade CFDs, ETFs, Forex, Futures, Options, Precious Metals, and Stocks on NOVA
Features of trading on NOVA
- Gain Access to Over 20 Global Exchanges
Capture opportunities from over 200 global futures from over 20 global exchanges - Trade Opportunities in Global Stocks
Over 11,000 Stocks and ETFs across Singapore, US, China, Hong Kong, Malaysia and Japan markets. - Charting Powered by TradingView
View live charts and gain access to over 100 technical indicators - True Multi-Asset Trading
Trade CFDs, ETFs, Forex, Futures, Options, Precious Metals and Stocks on a single ledger on NOVA - USD & SGD Shares Margin Rate at Only 4.5% p.a
- Fractional Shares from US$1
Start investing in fractional shares from US$1 notional value, at US$0.38 commission per order.