By Priyanka Sachdeva, Senior Market Analyst for Phillip Nova
The commodity markets faced multiple headwinds in 2023 – the continued conflict in Ukraine, extreme weather catastrophes, population migration trends post Covid, a weaker-than-expected economic recovery in Mainland China, and the financial stress with regards to the rising cost of capital. While one can sum up performance as volatile, we saw range-bound up & down fluctuations across most commodity sub-classes throughout 2023.
At the beginning of this year, many observers expected the post-COVID reopening of China, the mover of commodities in Asia will boost global growth in 2023, only to see that optimism quickly dashed.
Chinese recovery was largely subdued due to the ailing property sector in the country which startled global Industrial Metals, losing almost 7% year to date. The Energy sub-complex weathered storms of geopolitical crisis and economic slowdown. Despite OPEC+ multiple attempts to regulate supplies, energy markets seem convinced of surplus supplies in physical markets, resulting an overall drop in Dow Jones energy by 12%.
Better rainfall owing to El Nino led to a magnificent harvest in wheat and corn and other grains. Even supplies for war-struck Russia-Ukraine flowed swiftly. Grains losing over 21% this year has been the biggest contributor to an overall drop of 8% in the Dow Jones Commodity index this year.
Which commodities performed very well in 2023
Soft commodities whose harvests are hit adversely due to El Nino’s extreme weather phenomenon and precious metals which enjoyed a recent rally amid brightened hopes of FED’s pivot, are probably the only performers this year.
Topping the chart is cocoa with 65% year-to-date gains followed by orange juice with 57% gains. El Nino seemed to have a sweet tooth in 2023 and chipped away at the bulk of coffee and sugar produce this year. Confectionery and coffee dates have become an expensive affair in 2023 thanks to a jump of 16% and 6% in the prices of coffee and sugar respectively.
El Niño-related dryness was seen in much of Southeast Asia, with India supporting a price rally in rice, a staple food in Asia. In fact, the effect of El Nino over soft commodities isn’t fully realised as of now.
Although, slower economic growth in China weighed heavily on the industrial metals throughout 2023, iron ore witnessed some recovery in last quarter and stands at 22% ytd gains. Gold, the cult favourite proved itself as a safe-haven against all odds, whether it was elevated borrowing cost or the strength of the US Dollar. Gold proudly stands with a 13.5% gain year-to-date.
Which were the commodities that were hit the hardest?
El Nino propelled engines of many soft commodities by bringing heavy rainfall in the US and Brazil, which benefitted the production of wheat, corn and soybean. Additionally, the liquidation of cattle because of a drought in the Southern Plains led to a lower demand for corn in animal feed. Overall, US corn has seen a “surplus supply over demand situation,” and thus a significant price drop of over 30% year-to-date.
While the Russia-Ukraine conflict, initially hurt the “breadbasket of Europe”, wheat is now down by 20% year to date due to the Black Sea grain deal and Russia’s record level of exports. A bumper harvest is straining storage capacity and continues to pose headwinds over the world’s most traded crop even in 2024.
Palm Oil in Asia is yet another crop whose harvest flourished in 2023 while economic weakness across the globe, especially in China, has capped the demand and has left prices vulnerable. Palm Oil currently trades with over 12% losses year-to-date.
How did crude oil fare in 2023?
While energy is topping the charts on volatility, crude oil and natural gas are the worst-performing commodities for 2023 after the grains. The concerns of economic slowdown weighed heavily on global fuel demand. This was despite all manoeuvres by OPEC+ and voluntary cuts by Saudi Arabia of over 2 million barrels a day, oil failed to hold any gains. Despite a fierce pullback rally from June through September, that saw Brent come close to testing its key $100 per barrel psychological level, Oil is facing persistent economic headwinds, geopolitical tensions, and global inclination toward a green energy transition.
Oil players seem fixated on the global economic slowdown especially as China’s miserable recovery stripped chances of record global fuel demand this year. Both benchmarks Brent and WTI are trading almost 6.5% down year-to-date. However,in the last two weeks, there seems to be a different dynamic playing in crude oil.
Persistent conflict in the Red Sea is propelling a rally in crude oil while the thin market depth owing to the holiday season is adding further to complexities. It now appears that the Biden administration’s relaxation over Iranian crude oil supplies has backfired. Where Saudi “voluntary cuts” failed, Iran’s funding of Hamas attacks has accomplished for the prices of crude oil. At least from a short-term perspective the festering geopolitical tensions in the Middle East is extending the foundation for a rebound in ailing Oil prices.
Natural gas and other energy commodities
Natural gas has dropped an enormous 46% year-to-date while heating oil is down by 20.16%, in line with energy commodities as a whole. However, it is highly debatable, whether this weakness in energy is driven by elevated borrowing cost hurting business or it’s a warmer than usual winter in the Euro Zone or simply the strength of the US Dollar that weighing over prices. For now, we can safely say the headwinds over energy are numerous and persistent.
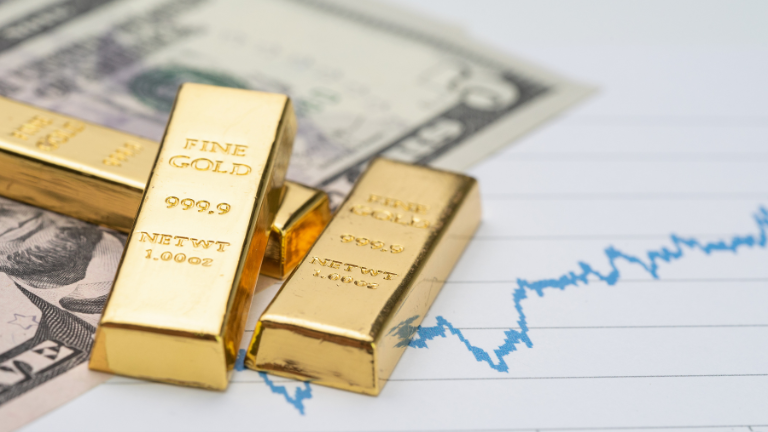
How did gold perform in 2023 and what are its prospects for 2024?
The notion that the Fed and other central banks have finished with monetary tightening has raised investors’ hopes that rate cuts may be on the agenda sooner than expected. The possibility of a Fed’s pivot channelled a pullback in US yields and the US dollar. This news was very much cheered by Gold which jumped to newer highs of $2152 per ounce on 4 December 2023. Some credit should also be given to the brewing geopolitical crisis that had swung fund flows towards the safe-haven of gold.
However, some technical corrections followed to test the support zone of $1980. This lead to a technical completion of a Reverse Head and Shoulders pattern on the daily chart. Gold has been impressively resilient to the rising rate scenario in 2023 and the current consolidation in the mid-2000 level is a good thing from a technical perspective.
Did the same positive momentum give silver a lift?
Silver was more volatile as compared to gold and garnered its fair share of attention from investors. Some silver forecasters expected the white metal to outperform gold in 2023 partly due to increasing demand from de-carbonization trends. However, that wasn’t the case and silver traded largely on the same market influence as gold.
Silver is used in solar panels, batteries, and different kinds of electrical components. Thus, the precious metal benefited from increased industrial demand this year, particularly in the technology, electric vehicle production and renewable energy.
Silver’s price trajectory has been similar to that of gold’s, with the bottom in March mildly below the threshold of $20 and prices have been on the rise since then. Personally, I feel it has breached this year’s high of above $26.43 is its recent rally, which should correspond to gold’s recent high. Silver, being the more affordable alternative to investing in gold and trading at a modest gain of 2% year-to-date, has the potential to breach beyond $26.50 if policy easing comes in 2024.
What are some key factors which will continue to weigh on commodity demand in the year ahead?
While inflation has receded, we believe it would be premature to claim victory. Infact economic strains will likely intensify in the coming months owing to the higher cost of capital. The most plausible outcome in my opinion would be a mild recession in the first half of 2024 which would trigger the Fed to embark on a series of modest rate cuts only in the second half of 2024. The US dollar should generally remain well-supported versus most foreign currencies in the first half of 2024, but will eventually wane. Even if Fed policymakers somehow land the inflation flight on a thin strip called a soft landing, real GDP growth in 2024 likely will be subpar, at best.
Hence, consumption and demand for commodities like base metals, industrial metals and fuels will likely be suppressed in the first half. In the latter half however, more stimulus measures from authorities can stabilise China’s real estate and the rate cuts may boost economic growth. This could lead to the US to possibly focus on rebuilding their crude oil reserves. In all possible scenarios, the global economy will still face an unsettled/uncertain climate in 2024, which will likely navigate fund flow toward precious metals.
Outlook for the commodities market in 2024
Three geopolitical hotspots that shaped commodities markets in 2023 are likely to remain focal points into 2024 as well – Russia-Ukraine, Israel-Hamas, and China-Taiwan.
All 3 have disrupted global markets in 2023, and I expect it to extend well into 2024. With Iran backing Hamas, the conflict between Israel and Hamas has become more explosive which can continue to threaten crude oil supplies in the Middle East. As nothing is likely to significantly improve on the geopolitical front, crude oil remains well supported at $70 per barrel.
Energy will be subdued with range-bound short-term spikes. Correction in industrial metals has room for rebound especially if China stabilises. The devaluation of Wheat & other Grains in 2023 has enhanced the net valuation attractiveness of agricultural commodities for 2024. El Nino’s staggered impact on tropical soft commodities, including sugar, coffee and cocoa, will continue to support agriculture’s overall attractive trend.
Which commodities should we keep a close watch on in 2024?
If I have to bet on one commodity, it will be gold. Gold has been impressively resilient, given rising real yields and the strong US dollar. As long as consumption patterns are strong, coupled with priced in modest rate cuts, gold’s flight is set to take off in 2024.
Technically, gold completed a Reverse Head and Shoulders pattern when it breached $2,100 in December. The 300-point rally from the low 1,800s to $2,100 indicates another 300-point swing on the upside with a target of $2,400 per ounce of gold. This is only possible if gold continues to hold the $1,980 support!
Opportunities in gold could lie in a buy on dips strategy for the key support zones. Any escalation in geopolitical tensions and clear signs of recessions will also be the catalyst for gold in 2024.
What are some of the key events investors should look out for?
2024 is an election-heavy year where most of the world’s top economies will be witnessing power struggles and the results will be keenly watched events which will potentially shape the financial and commodity markets in 2024.
Secondly, the pace, tone, and longevity of ongoing geopolitical clashes will be the limelight of 2024. How adversely these geopolitical events will affect trade, commerce, and businesses will shape the prices of commodities in 2024. The tensions in the Suez Canal are mounting, the war in the Middle East seems to be escalating, Iran looks increasingly involved in the conflict, OPEC wants to restrict production despite internal disagreements, and central banks are preparing to cut rates. But interestingly, none has been enough to provide momentum for the crude oil bulls.
Third will be the monetary policy easing and recession risk. The hard versus soft landing debate about the likely course of the U.S. economy continues. Deflation is underway, while rate cuts might not seem imminent as of now. However, markets are increasingly growing impatient for the Fed to start cutting rates early 2024.
Trade CFDs, ETFs, Forex, Futures, Options, Precious Metals, and Stocks on NOVA
Features of trading on NOVA
- Gain Access to Over 20 Global Exchanges
Capture opportunities from over 200 global futures from over 20 global exchanges - Trade Opportunities in Global Stocks
Over 11,000 Stocks and ETFs across Singapore, US, China, Hong Kong, Malaysia and Japan markets. - Charting Powered by TradingView
View live charts and gain access to over 100 technical indicators - True Multi-Asset Trading
Trade CFDs, ETFs, Forex, Futures, Options, Precious Metals and Stocks on a single ledger on NOVA - USD & SGD Shares Margin Rate at Only 4.5% p.a
- Fractional Shares from US$1
Start investing in fractional shares from US$1 notional value, at US$0.38 commission per order.