Many traders have a “big picture” view — maybe inflation is easing, growth is slowing, or central banks are shifting direction. The hard part is turning that view into a trade without getting distracted by individual stock news.
That’s where indices CFD can be helpful. For traders involved in CFD trading Singapore, indices offer a practical way to express macro views without selecting individual stocks. An index (like the S&P 500 or DAX) tracks a basket of major companies, so it often reflects how a whole market is doing. An index CFD lets you trade that index’s price movement without owning the underlying shares. On Phillip MetaTrader 5, all the contracts are traded with zero commission, including index CFD, which makes them a simple, cost-efficient way to access broad market close to 24 hours a day, 5 days a week.
What “Big Picture” Means in Trading
In trading, the “big picture” refers to a macro view — your perspective on the broader forces that can move markets. Instead of focusing on one company’s earnings or a single chart pattern, you’re looking at what’s happening in the wider economy and how that may influence markets over weeks or months.
Most macro views come back to a few common drivers:
- Growth: Is the economy speeding up or slowing down?
- Inflation: How fast are price levels rising or falling?
- Interest rates and central banks: Could monetary policy shift toward tighter or looser financing conditions?
- Risk sentiment: Are investors feeling confident (“risk-on”) or defensive (“risk-off”)?
It’s also worth knowing that markets don’t move on economics alone. Geopolitical and domestic political events can shift sentiment quickly, sometimes overnight. Things like tariff conflicts, trade deals, major policy changes, elections, or sudden regulatory headlines can change expectations for economic growth, inflation, and corporate profits, feeding into broad market moves.
A macro view is different from short-term speculation. Short-term trades are often driven by quick price swings or short-lived news. Macro positioning is usually more about the ‘why’ behind a move and the bigger catalysts that can reshape the market’s narrative over a medium- to long-term horizon, such as central bank policy, major political developments, or longer-term technological shifts (e.g., artificial intelligence).
This approach appeals to active traders because it adds structure. Instead of reacting to every headline, you focus on a few key drivers, watch the events that matter most, and choose trades that match the bigger picture you’re expecting.
Why Traders Use Indices CFD for Macro Positioning

Once you have a macro view, the next step is choosing a way to express it. For many traders, indices CFD are popular and practical because they allow you to trade the bigger picture with the flexibility of CFDs.
Broad market expression
An equity index tracks a basket of stocks. Popular indices like S&P 500 and Hang Seng Index represent leading companies in a country or region, which help traders focus on the broader direction of the local market instead of taking on company-specific risks.
Tradability and flexibility
On Phillip Nova’s trading platforms, indices CFD can be traded close to 24 hours a day, five days a week, making it easier to react to macro news and economic releases without waiting for the local stock exchange to open. By comparison, ETFs are typically traded only during regular exchange hours.
Tool to diversify or hedge existing positions
Indices CFD can also help traders manage overall portfolio risk. For example, if someone holds a basket of stocks in one region, they may hedge against a potential market pullback by shorting the index CFD that matches their exposure. Traders may also use indices across different regions to diversify risk exposure instead of concentrating in one market.
A Simple Framework: How an Indices CFD Expresses a Macro View
A helpful way to approach macro trading with indices CFD is to map out a step-by-step plan. Instead of reacting to every headline, you decide what you’re trading, why you’re trading it, and how you’ll trade it. A simple plan looks like this:
- Choose markets: Start with your market universe (e.g., US, Europe, Asia) and focus on markets you know best.
- Form a view: What do you expect to happen in those markets and what’s driving that view (e.g., economic growth, technological shifts, policies)?
- Select the index: Pick the index that matches your view and exposure. For example, if you expect AI-led momentum to continue in the US, you might focus on Nasdaq 100. If your view is about the broader US economic outlook, you might look at Dow Jones (US30).
- Catalyst window: Identify the events that could confirm or challenge your view and when they might happen.
- Entry/exit plan: Decide what needs to happen before you enter the trade, how you’ll take profit and what would make you step aside.
- Risk plan: Set position size and a clear stop-loss level. Define what would prove your view wrong, so you’re not holding a trade when market conditions change.
This framework is easiest to apply when you can monitor price action and news-driven moves across multiple markets in real time. With Phillip MetaTrader 5, traders can access indices CFD across the US, Europe, Japan, China, and Singapore, view multiple charts at once, and set price alerts to stay on top of key levels.
Catalysts Traders Should Watch
Big market moves often start when new information changes how the market sees the outlook. For traders using indices CFD, these catalysts usually fall into a few broad categories.
1) Economic data releases
Scheduled data can move markets quickly, especially when it is well above or below expectations. Over time, long-term data trends also shape how policymakers and businesses view and respond to economic conditions.
Common market-moving releases include:
- Inflation: CPI/PCE
- Jobs: employment reports, jobless claims
- Growth: GDP, PMI
2) Central bank decisions and guidance
For indices, markets often react more to central bank messaging (e.g., the chair or governor’s speeches) than the rate decision itself. Traders focus on anything that shifts expectations about the policy path. For example, interest rates may stay higher for longer, rate cuts could come sooner than expected, or balance sheet/liquidity policy might shift.
3) Political catalysts
Politics can move indices by changing expectations for economic growth and business profits through policies such as taxes, spending, regulation and trade policies.
- Domestic policy & politics: elections, budgets/fiscal policies, regulations
- Geopolitics & trade policy: tariffs, trade deals, sanctions, conflicts etc.
Such developments may trigger “risk-off” moves when they increase uncertainty especially if investors price in a higher chance of slower economic growth or weaker business earnings.
4) Risk sentiment and volatility shifts
Sometimes the market’s biggest driver is simply mood. When investors switch from risk-on (comfortable taking risk) to risk-off (protecting capital), they often reduce exposure broadly in multiple markets. That can push indices down quickly and increase volatility.
Example: European Index Euro Stoxx 50.
The EURO STOXX 50 is a good example of how macro forces show up in price action. From September 2025 into early 2026, European equities strengthened as market expectations stayed broadly supportive. Its price chart highlights a common macro pattern: an uptrend punctuated by key events that either reinforce or challenge the narrative.
The uptrend gained traction after the European Central Bank held interest rates unchanged in September 2025, which helped keep euro-area policy expectations steady. Over the same period, the US Federal Reserve cut interest rates, creating a policy gap between the euro area and the US. Later, the US political headlines tested global market sentiments periodically.
What to annotate on the chart:
- Sep 11, 2025 – ECB held rates unchanged: helped stabilise expectations around euro-area policy and supported sentiment.
- Oct 1, 2025 – US government shutdown begins: a risk event that increased uncertainty of the US market.
- Nov 12, 2025 – Shutdown ends: the removal of a major uncertainty helped risk appetite stabilize in the US market.
- Jan 2, 2026 – Strong start / new highs: European equities opened 2026 at a record high, reinforcing optimism in the region’s growth.
- Mid-Jan 2026 – Tariff threats linked to Greenland: political headlines triggered a short-term risk-off reaction.
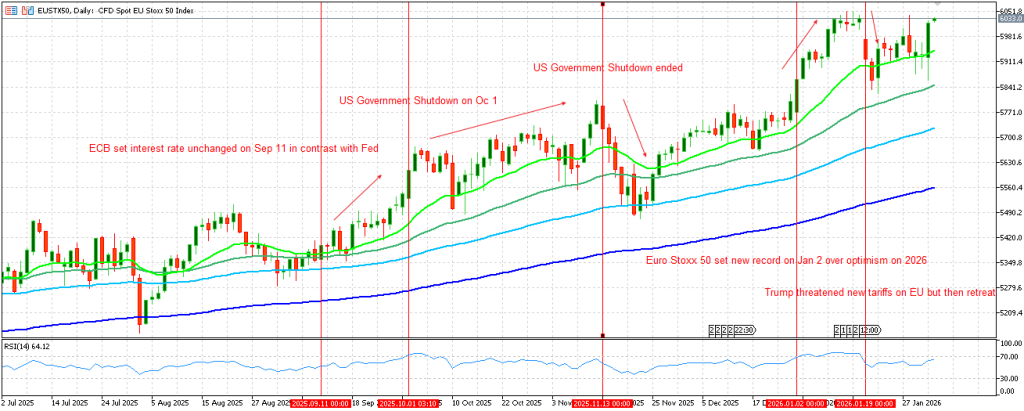
Source: Phillip MetaTrader 5
This example highlights that macro trading isn’t only about predicting events. It’s more about reading the market’s response. If the index dips on a negative headline but resumes the trend, it suggests the broader narrative (e.g., Euro Area’s positive economic outlook and stable policy rate) may still be intact. If it fails to recover and starts breaking below previous support level after negative events, it may be a sign that expectations are shifting.
Timing Macro Trades Effectively
The EURO STOXX 50 example shows a useful idea: macro trends often move in waves, and key events act like checkpoints. The practical question is when to enter.
Start small, then wait for alignment
Begin with your macro view (e.g., “Europe looks supported” or “risk is rising”), but avoid deploying all your capital at once. A more practical approach is to start with a small position and only add more if the market begins to confirm your idea. For example, if an index starts rising after a central bank signal, a trader might buy in small lots first. If price then holds above a previous resistance level (showing the move is sticking), the trader can add gradually—rather than committing heavily at the start.
Use catalysts as “checkpoints,” not predictions.
Instead of trying to predict each data release or policy headline, treat them as checkpoints on the price chart:
- If the market price absorbs the event and holds its direction, your view may be gaining support.
- If the market repeatedly fails to recover after negative news, it may be a sign the trend is fading.
This keeps you focused on what matters most: how the market reacts, not just what the news says.
Match your entry to your holding period
If your view is short-term, you’ll usually want quicker confirmation and tighter decision-making. If your view is medium-term, you can allow more short-term noise and build the position in small lots as the trend develops. Either way, you still need a plan for when and where to exit—both for taking profit and for stepping aside if the market proves your view wrong.
Risk Management for Macro Trading

Risk controls matter just as much as entry ideas. Even if a macro view is right over time, markets can swing sharply in the short run. Here are a few practical methods:
Size down when uncertainty is high
When volatility rises, the market looks overheated or a major catalyst is near, it often makes sense to reduce position size. Smaller size gives you more room to stay in the trade through sharper swings. As conditions become clearer, you can always scale exposure back up.
Watch correlations and control total exposure
Diversification across markets can help spread risk, but in stressed or “risk-off” periods many indices can fall together. To avoid being overexposed, some traders set an account-level risk limit, which is a maximum loss they are willing to accept over a day or week, and size their positions so potential losses stay within that limit.
For example, if an account has USD 1,000,000, a trader might set a maximum daily loss of USD 50,000. If losses reach that level during a stressed session within a day, the trader may cut exposure and stop trading for the day to avoid a much larger drawdown.
Understand leverage and why stop-loss matters
Leverage is a key feature that makes CFDs different from ETFs. It lets you control a larger market exposure with a smaller deposit, but it also means small index moves can translate into much larger gains or losses relative to your account.
That’s why position sizing and account-level rules (like a maximum daily loss limit) are so important. If leverage is too high for the day’s volatility, losses can escalate quickly and eat into capital.
Example: With 10× leverage, a 10% adverse move can roughly equal a 100% loss of the amount allocated to hold that position, which may trigger a margin close-out.
Being aware of trading costs
Trading costs mainly come from holding and execution.
- Financing / overnight fees (swaps): Holding an index CFD position overnight may result in a swap charge or swap credit, depending on trade direction and product pricing. Over multiple nights, these costs (or credits) accumulate, so they matter more for longer holding periods.
- Spreads and execution costs: The spread is the difference between the buy and sell price. Spreads can widen during volatile periods or outside the most liquid hours, which can make entering and exiting more expensive. Phillip Nova offers competitive spreads on indices CFD across multiple markets with zero commission on Phillip MetaTrader 5, helping keep trading costs more predictable.
Conclusion
Indices CFD help traders translate macro views into broad market exposure without constructing a portfolio of stocks. Use a simple process: choose the markets, pick the right index, watch the catalysts that matter, plan entries, exits and risk management. Macro trading can become more disciplined. Indices play an important role in CFD trading in Singapore, especially for traders who want structured exposure to broad regional and global markets.
New to macro trading? Phillip Nova’s demo account allows you to practise trading index CFDs on Phillip MetaTrader 5 using live market prices, helping you understand how macro themes play out in real time without risking real funds. Traders can begin with a demo account and open a live trading account on Phillip MetaTrader 5 and/or NOVA when ready. For those who prefer guided onboarding, Phillip Nova also offers client support to help you get set up and start practising with confidence.