1. What is Technical Analysis?
Technical analysis is a popular form of analysis used by traders of financial instruments to evaluate price actions and identify trading opportunities. Technical analysis relies on historical price data to predict future price actions. A key assumption in technical analysis is that history tends to repeat itself and price patterns can be used to forecast future price based on past price behaviour. Unlike fundamental analysis, technical analysis assumes that all public information including fundamental factors are already reflected in the price of the security.
Technical analysis is a useful skill to help traders determine entry and exit points.
2. Basic Concepts
2.1 Understanding Japanese Candlestick
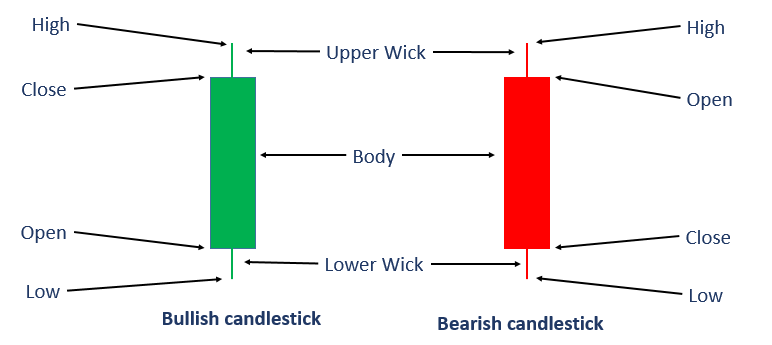
A common chart type that technical analysts use to study price action is the candlestick chart. Also known as the Japanese candlestick, it provides useful insights on the price actions throughout the observed period.
A candlestick consists of two main components, a body and a wick(s).
Each candlestick provides a summary of price movements in the specified timeframe, ie, on a daily chart, one candlestick summarises price actions of one trading day. The information displayed by the candlestick include opening price, high, low and closing price of the timeframe.
2.2 Candlestick patternscharts
A single candlestick is not particularly useful when used by its own. It is more powerful when used with other candlesticks to confirm the sentiments of price direction.
3 powerful reversal candlestick patterns:
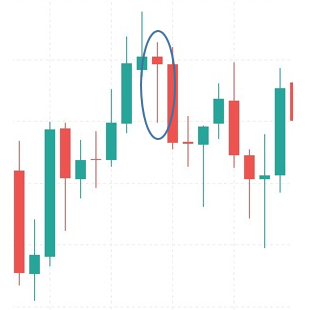
a. Doji
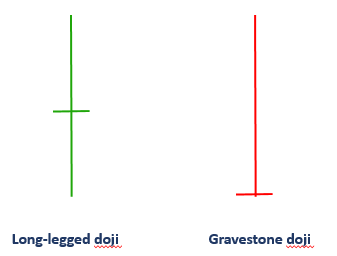
- Doji candlestick occurs when opening price equals closing price
- Represents indecision at significant high or low
- If spotted at strong support/resistance, it could be signaling a possible reversal in trend
b. Engulfing Candles
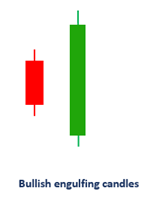
- Occurs when a series of prices are moving downwards
- Prices tend to reverse upwards after this occurrence
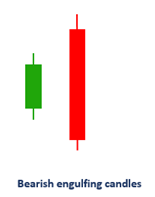
- Occurs when a series of prices are moving upwards
- Prices tend to reverse downwards after this occurrence
c. Hammer

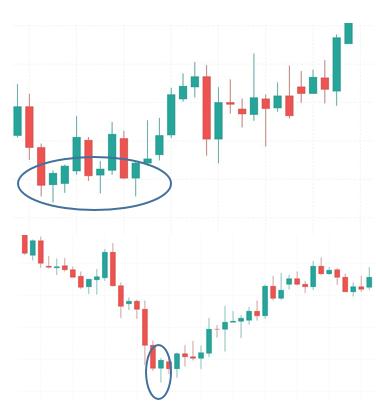
- Occurs after a series of downward moving prices
- Hammer occurs when closing prices are very close to the opening price with the body is concentrated to the top of the candle.
- Long shadow at the bottom of the candle represent the bulls successful attempt to stop the bears from pushing price lower
- Price tends to reverse upwards after this occurrence
d. Hanging man

- Occurs after a series of upward moving prices
- Hanging Man occurs when closing prices are very close to the opening price with the body is concentrated to the top of the candle.
- Long shadow at the bottom of the candle signals weakening support as selloffs are occurring just below.
- Price tends to reverse downwards after this occurrence
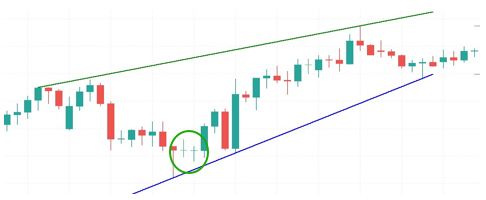
2.3 Trends analysis
“The trend is your friend” is a common saying in technical analysis where prices that move in a trend tends to stay in the trend. As the trend gets established, future price movement is more likely to follow the same direction as the trend.
There are 3 types of trends:
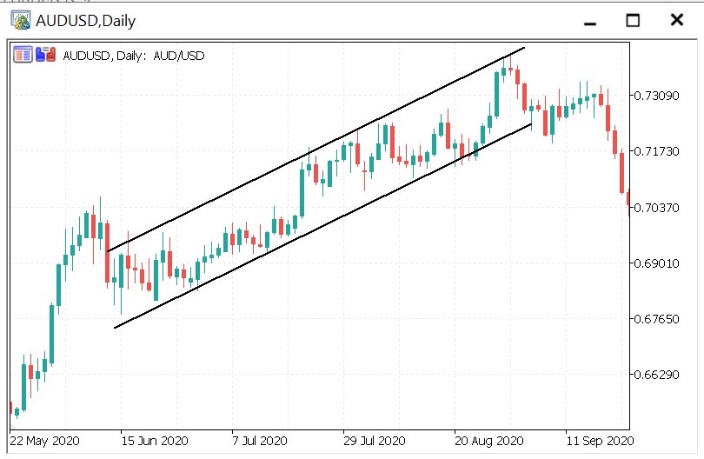
Uptrend:
1. Identified when higher highs (HH) and higher lows (HL) are formed
2. Trend line has to connect 3 low points to be validated
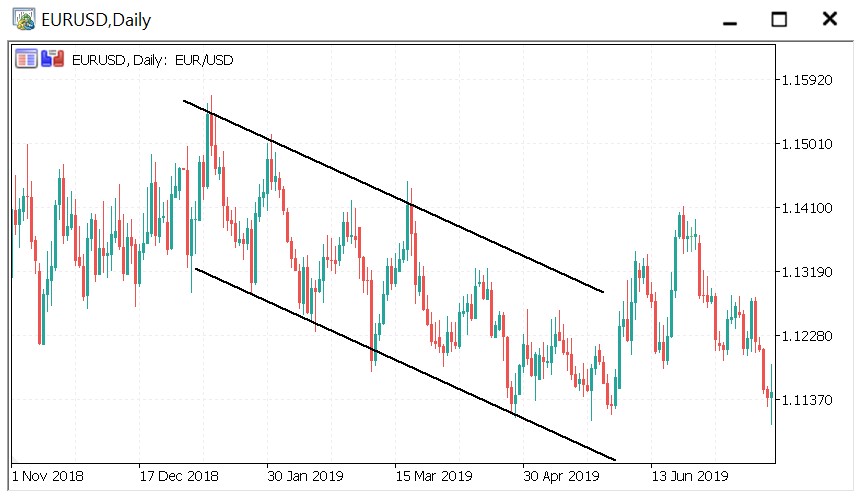
Downtrend:
1. Identified when lower highs (LH) and lower lows (LL) are formed
2. Trend line has to connect 3 high points to be validated
Sideways trend
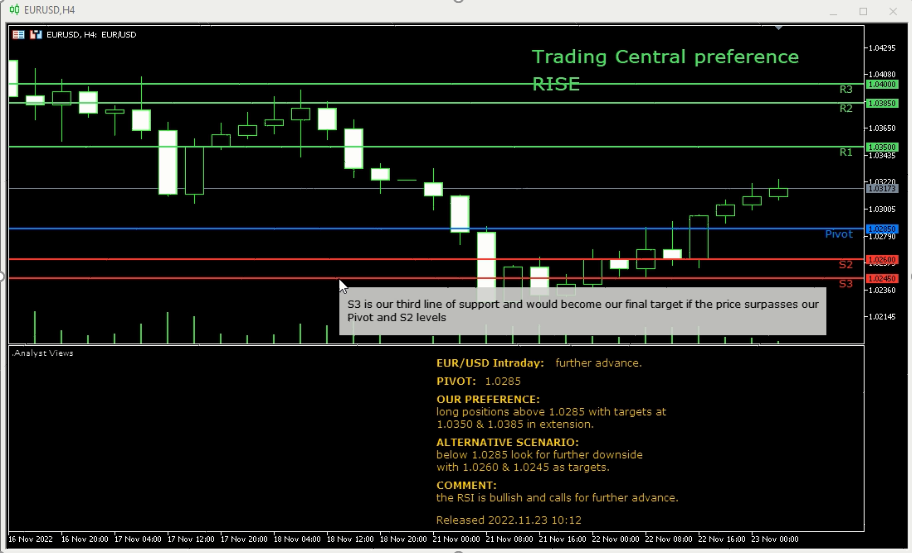
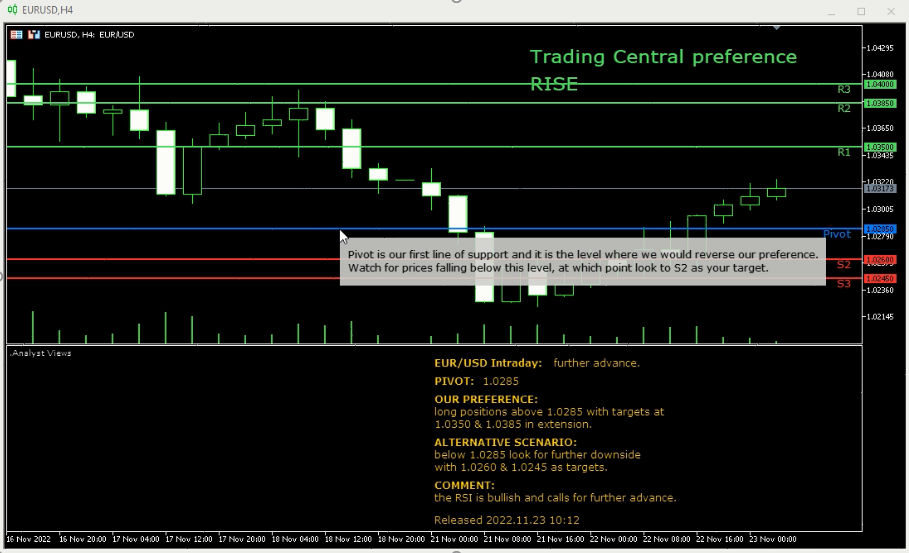
2.4 % Support and Resistance
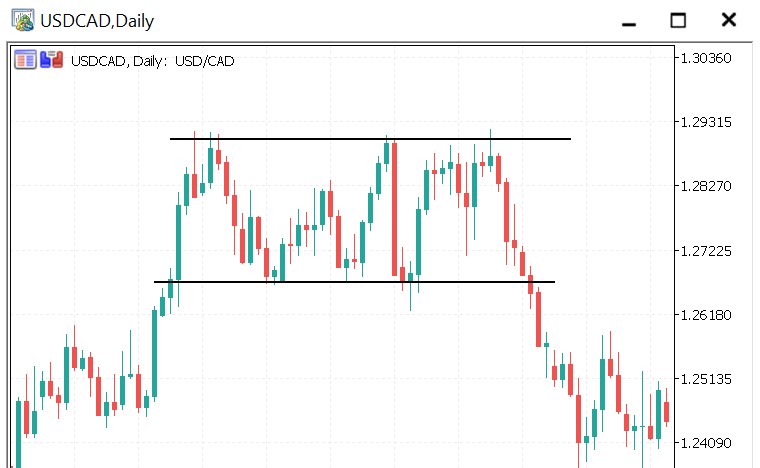
Support and resistance is another key concept in technical analysis as it provides traders with levels on charts where prices tend to stop and reverse.
Support is an imaginary floor that stops prices from dropping further. Downtrend can be expected to pause due to concentration of demand and buying interest.
Resistance is an imaginary ceiling that cap prices from moving above and selling interest arises when prices hit the resistance zone.
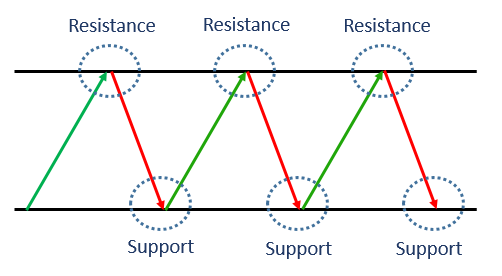
Whenever prices arrive at resistance or support zones, two typical scenarios could potentially play out.
- Prices bounce back away from the support or resistance zone.
- Prices violate the levels (breakout) and continues on the direct until the next support or resistance is hit.
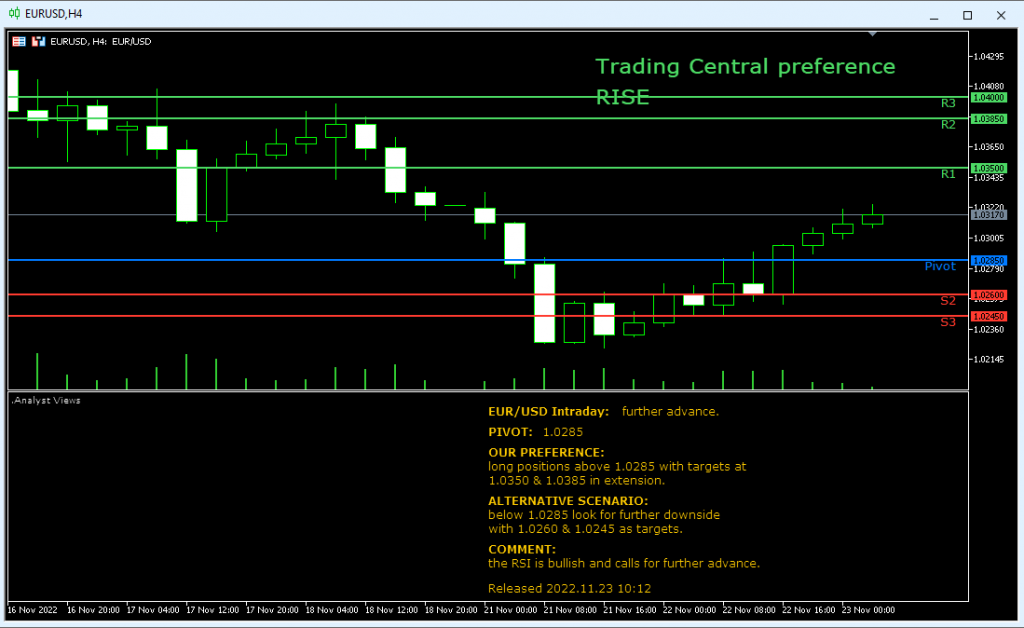
3. Easily identify support & resistance levels with free trading tools on Phillip MT5
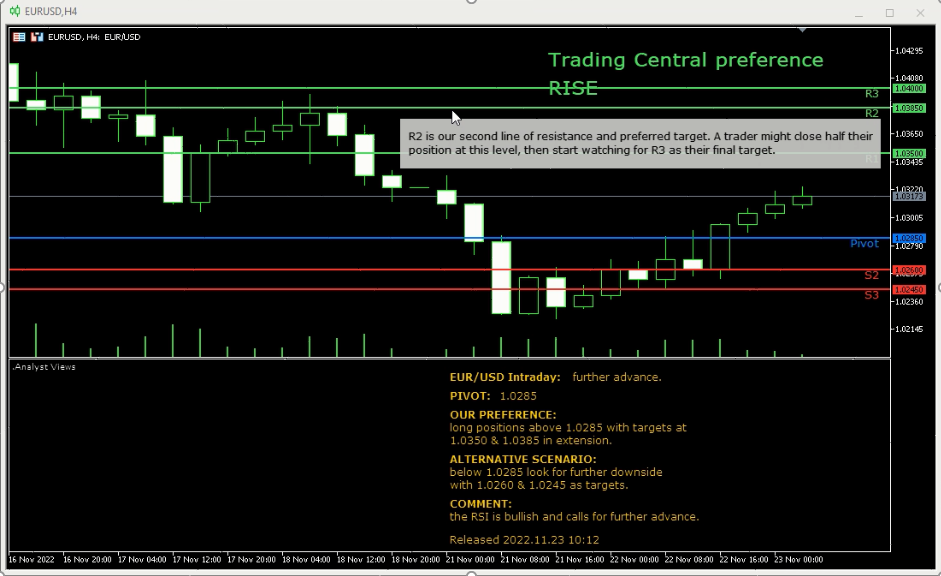
Phillip MT5 comes in a suite of free and powerful trading tools including the “Trading Central Technical Views” which offers a unique and invaluable combination of senior analyst expertise and automated algorithms to offer you with actionable trading plans.
Meanwhile, Trading Central’s global team of expert market technicians are present to validate all analytical output to ensure only the best analysis is published.
For investors looking for their next idea, TC Technical Views provides immediate positions at any time for the most liquid instruments globally. For those who already have an investment idea, TC Technical Views is a repository of professional second opinions. Partnered with their patented pattern recognition technology, TC Technical Views is constantly scanning the market to provide full position management on all available contracts. By dragging and dropping this tool on your chart, you would better understand the technical scenario at a glance with the pivot, support and resistance levels automatically populated on your chart.