A Deep Dive into The AEM Holdings Opportunity

18 Mar 2022

By Eric Lee, Account Manager, Phillip Nova

AEM Holdings Ltd is a company that provides handling and testing solutions in the semi-conductor industry. The company was founded on 21 July 2000 and is headquartered in Singapore.

AEM Holdings Price Chart
Source: Bloomberg

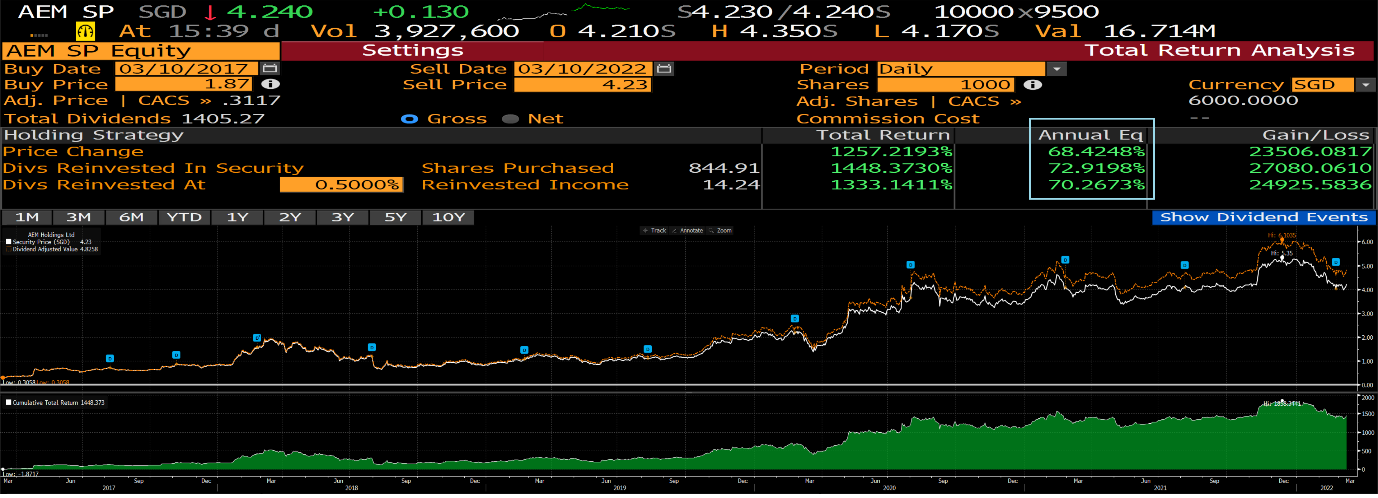
When we performed a Total Return Analysis on the share price performance of AEM over the past 5 years, we can see that its growth was phenomenal at an annualised rate of 68% p.a. When its dividend was re-invested into the stock, its annualized rate was 73% p.a. as boxed up in blue above.

One technique I use for tracking and understanding the performance of a stock is by measuring the average growth rate of its Revenue, Earnings Before Interest & Tax (EBIT) and its Property, Plant & Equipment (PPE) over a period of years. Usually, it is best to study the numbers of at least a 5 year period to derive a meaningful average.

A company’s share price is a function of its business operations. As a business grows, its growth should also be observed in its sales, earnings and assets. As shown on the table below, the average growth rate of these 3 metrics over the past 5 years for AEM was 69%, which is very close to the annualised growth of its share price over the same period as in the Bloomberg chart above.

Revenue, EBIT and PPE growth for AEM Holdings for the last 5 years
Source: https://www.koyfin.com/

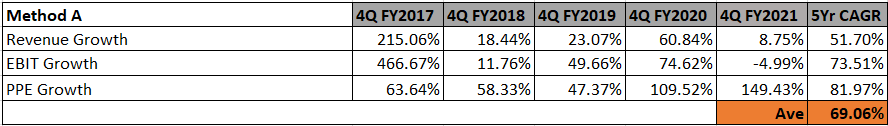
Firstly, we can conclude that the share price is fairly valued based on the above method. Secondly, we should also continue to monitor the growth of these 3 metrics when the company announces its quarterly results. If there no signs of slowdown in growth, we can project its average growth rate and use that as a basis for its share price projection.

Another observation we can make, was that the AEM management has also been actively buying back its shares in the market since 2012. Below are the records from their share buy-back from August 2020 to March 2022. The buy-back prices of these dates are closer to current share price and thus more relevant to our analysis. Looking too far back will not yield much benefit. If you are interested to find out more, can refer to the link provided below. From the dates of their share buy-back, we can see that management have been actively buying back shares since May 2021.

Digital advertising spending worldwide from 2019 to 2024

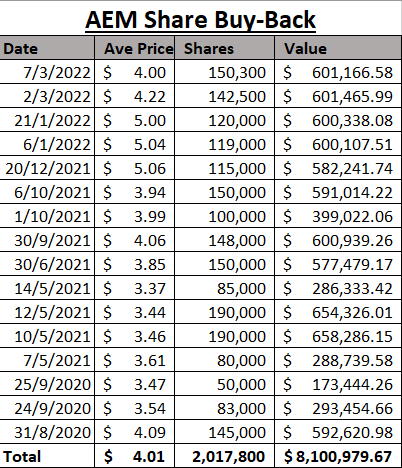
Source: https://www.sgx.com/securities/company-announcements

Technical analysis foe AEM Holdings

Source: Phillip Nova

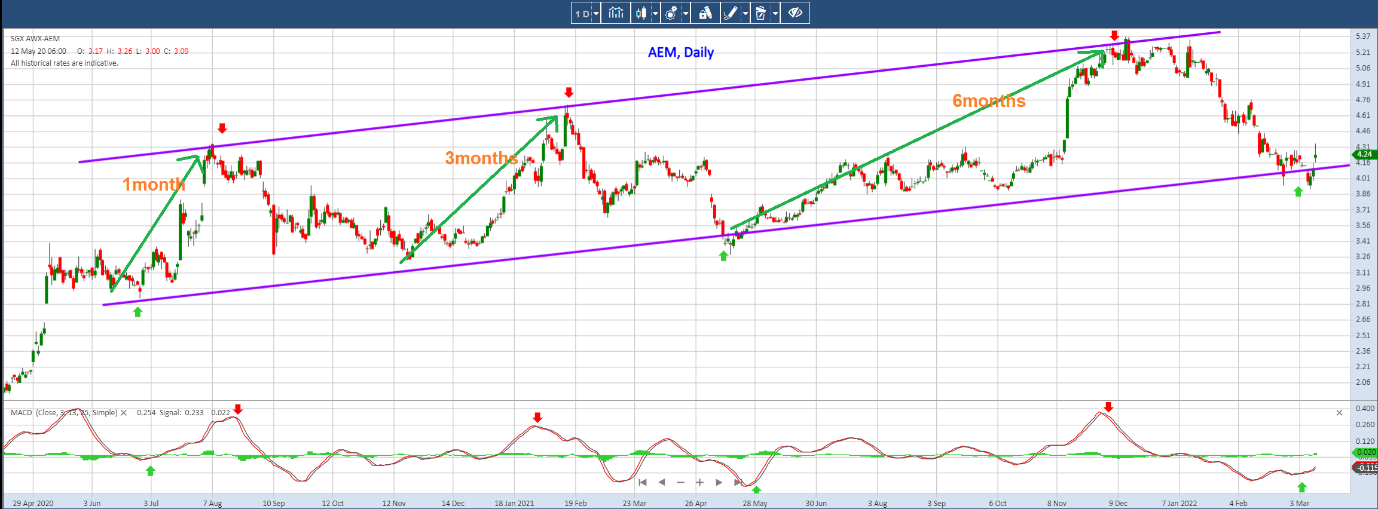
Technical analysis wise, the share price looks to be bouncing up from the lower boundary of the upward-sloping channel (in purple). This is the 3rd time the bounce on this channel is observed. The first time was in May 2020. Second time in December 2020, when it hit the upper boundary of the channel. Is it going to happen again this time? No one knows for sure, so we can only trade based on what we have observed and always have a proper money management strategy in place to protect against a potential downside.

An interesting thing to note is that it took the share price 1 month to reach from the bottom to the top of the channel in May 2020. It then took it 3 months to reach from the bottom to the top of the channel in December 2020. During its most recent run-up, it took the share price 6 months to move from bottom to top. Assuming that the pattern was to repeat, we can then project that it may take the share price 9-12 months to reach the upper boundary of the channel, indicating a possible target price of $6-$6.20 region 9-12 months later.


Eric Lee is an Account Manager with Phillip Nova. With expertise in Futures, Forex, Stocks, and Unit Trust, Eric makes an all-rounded advisor. Make informed trading decisions without spending time combing through endless information as Eric readily provides clients with trade alerts and insights via WhatsApp. Over his years of experience, Eric developed systematic strategies in trading and investing. Book a complimentary coaching session below to leverage on his expertise as he imparts his knowledge to enhance your trading journey.

An Exchange Traded Fund (ETF) is a marketable security that is formed to track nearly anything, ranging from a specific index, sector, commodity, or increasingly, theme. They are most commonly used to track a basket of stocks, and can typically be accessed through the same channels as regular stocks. ETFs are typically separated into passively-managed ETFs that simply mirror the security they are tracking (e.g. the STI), and actively managed ones that attempt to deliver higher returns or specific investment objectives, often with a pre-specified theme in mind (e.g. ARK Invest’s Innovation ETF).

Why should I trade in ETF CFDs?

  • ETFs have been growing in popularity over the years. 2020 was the best year for ETFs yet, with global equity ETFs seeing more than $1T in inflows within a 12-month period. Using CFDs to gain exposure to ETFs allows for greater capital efficiency because only a portion of the contract value is required as margin to establish a position.
  • ETFs are particularly popular with investors seeking a relatively hassle-free investing experience, while desiring exposure to a range of specific and relatively understandable securities. Trading ETF CFDs brings greater convenience by eliminating the need for traders to hold multiple currencies in order to access global ETFs.
  • An investor wanting exposure to the post-pandemic economic recovery could open a position in the well-known SPDR S&P 500 ETF (SPY), which tracks the performance of the S&P 500. Another investor that may be convinced of the future importance of Environmental, Social and Governance concerns (ESG) may find the increasing selection of ESG-themed ETFs that track a basket of high ESG-rating companies to be a good investment, rather than cherry-picking individual equities by hand. ETF CFDs can act as a powerful tool for traders can profit from both directions of the market by taking on long or short positions.

A look at two ETF CFDs we offer:

1) Has the ARKK been sunk?

ARK Innovation ETF (ARKK) ARKK is an actively managed ETF by ARK Invest that invests in a range of companies based on their innovative and industry-disrupting potential. ARKK’s largest holdings are in companies such as Tesla, Square, and Zoom. ARKK is down around -33% from peaking on 12th Feb and is currently in the red for the year to date as the market experiences a risk-off outflow of funds. Superstar fund manager Cathie Wood has however been consistently doubling down on her bets, buying even more shares in growth stocks that are going through their own tumultuous periods such as DraftKings, Peloton, Teladoc, and Tesla. In her view, ARKK is playing the long game, and remains steadfastly convinced in the long-term prospects of these growth stocks beyond this current bout of volatility. Similarly on outflows, investors are still betting big on ARKK as ARK Invest has only lost about $1.2B in assets this year across all its six funds, compared to seeing an inflow of $15.1B during the same period. Recently, investors have been nervously eyeing ARKK’s basket of tech stocks as their future earnings potential remain vulnerable to erosion through high inflation – the dominant concern of the market in recent weeks. As commodities – the major contributor to the recent heightened inflation fears – drops sharply from record highs, are investor concerns over hyperinflation overblown?

2) Searching for exposure to Asian equities?

iShares MSCI Asia ex Japan ETF (AAXJ) The AAXJ is currently trading -10.6% adrift of all-time highs seen in February, giving up gains in tandem with an Asia-wide equity sell-off at the time. Given that slightly over 40% of the ETF’s holdings are based in China, the ongoing tumult seen in Chinese equities currently have carried over nearly perfectly in the AAXJ, as Chinese investors take a breather after the stellar gains made over the past year. Looking ahead, Asia – and particularly China, is steaming ahead with its economic recovery. China is widely expected to be one of the best-performing major economies this year, providing a major boost to the outlook for corporate earnings. As the rest of Asia and the world gradually opens up their own economies, AAXJ is likely to again benefit from strong Asian outperformance amidst a strengthening trade outlook.

CFD is available for trading on Phillip MetaTrader 5 (MT5).

Features of trading CFD:

  • Trade in both the bull and the bear markets
    The ability to enter a long and/or short position allow traders to take advantage of both rising and falling markets.
  • Smaller barrier to entry
    Flexible and smaller contract sizes. This means that traders will be able to enter into a contract with a modest amount of capital.
  • No expiration date or risk of delivery
    Unlike futures which commonly have a fixed expiration date, CFD allows traders to perpetually hold the position(s). CFD is cash settled, no need to worry about the delivery of the underlying asset.


Benefits of using Phillip MT5:

Trade at zero commission on a dynamic platform that offers low spreads. Integrated with Autochartist and Trading Central Indicators, and available on mobile, web and desktop app, you will never miss a trading opportunity with Phillip MT5.

Register for a FREE 30-day Phillip MetaTrader 5 Demo Account

More Market Trends

By Danish Lim, Investment Analyst, Phillip Nova   Platinum, despite being 30 times rarer than gold and having usage as both a precious and industrial

Read More >

Weekly report courtesy of Eurex   Following the previous week’s focus on the US Federal Reserve’s interest rate policy, the markets are now turning their

Read More >

By Danish Lim, Investment Analyst for Phillip Nova   The SGX FTSE China A50 Index Futures contract derives its value from the FTSE China A50

Read More >