EN
 CN


Gold remains one of the most closely watched markets in 2026. Following a strong rally through 2024 and 2025, prices reached a record high above $5,600 in January 2026 before correcting toward $4,000. Gold has subsequently rebounded above $4,600, but has since eased toward $4,200, highlighting significant volatility within the broader uptrend.
So, what is driving gold prices in 2026? Key factors include the Fed’s interest-rate outlook, Treasury yields, the US dollar, investment and central-bank demand, geopolitical risks and inflation.
This article examines how these forces are influencing gold prices, what investors may want to monitor through the rest of 2026, and the key technical levels to watch.
What Drives Gold Prices in 2026?
Several prices influence gold prices have pulled in different directions in 2026. Macroeconomic developments, including inflation, labour-market data and energy prices, can influence Fed expectations, which are reflected in US Treasury yields and the US dollar. Investment flows indicate how capital is moving into or out of gold, while central-bank demand and geopolitical uncertainty can provide a longer-term structural support.
How Fed Expectations Affect Gold Prices
Gold has traditionally faced pressure when the US dollar and Treasury yields rise, although the relationship is not consistent.
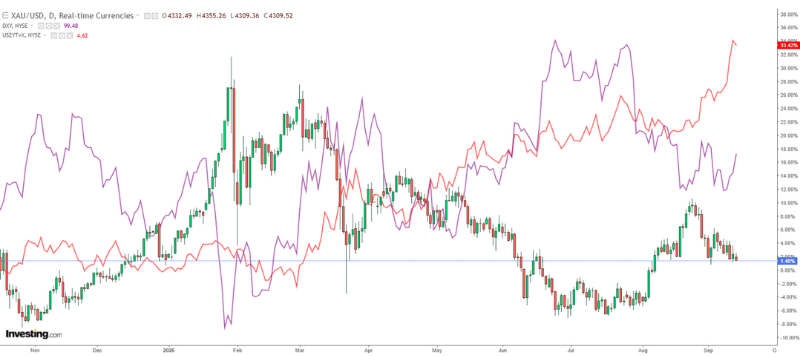
Before late August, gold rebounded strongly from around $4,000 despite elevated U.S. Treasury yields. A weaker US dollar reduced one source of pressure, while strong inflows into gold-backed exchange-traded funds (ETFs) inflows supported the recovery.
Ahead of the September Fed decision, rising oil prices and firmer inflation expectations increased expectations for a more restrictive policy path. The US dollar strengthened and Treasury yields rose further, with the 10-year Treasury yield exceeding 5%. Gold subsequently lost some of the momentum gained since late August.
On 16 September, the Fed raised its target range by 25 basis points to 3.75%–4.00%, citing still-elevated inflation and solid economic activity. Fed Chair Kevin Warsh also indicated that further tightening remained possible if inflation did not cool sufficiently. The decision reinforced expectations of additional tightening.
For gold, the key question is how far the tightening cycle could extend. A stronger dollar and higher yields could increase near-term pressure on gold, while easing expectations of further tightening may reduce that pressure.
Investors can monitor the US Dollar Index (DXY) and Treasury yields to assess how markets are repricing the Fed outlook. The 2-year Treasury yield is particularly relevant to near-term monetary policy expectations, while longer-dated yields reflect broader expectations for inflation, economic growth and financial conditions.
Source: investing.com
Investment Flows Are Reinforcing Gold’s Price Moves
Investment flows have played an important role in gold’s 2026 price movements, reinforcing both the correction from record highs and the subsequent rebound.
Earlier in the year, profit-taking and ETF outflows accompanied gold’s decline from its peak, with selling pressure continuing into May. As prices approached the US$4,000, renewed buying helped support the recovery.
In August, global gold-backed ETFs attracted approximately US$18 billion, the second-largest monthly inflow on record. Holdings also increased by 121 tonnes to a record 4,189 tonnes. The World Gold Council’s Gold Return Attribution Model also identified momentum as the primary driver of gold’s August rebound, supported largely by improved ETF and futures positioning.
ETF flows can shift quickly, but sustained inflows or outflows can reinforce broader price trends. Renewed selling could also leave gold more exposed to pressure from a stronger US dollar and higher Treasury yields.
Geopolitical Risk and Central Bank Demand Provide Structural Support
Geopolitical uncertainty and central-bank demand can provide a more persistent source of sentiment and structural support for gold. Tensions in the Middle East, concerns over trade and energy security, and reserve diversification can strengthen demand beyond individual periods of market stress.
While these forces do not necessarily determine short-term price direction, they may help explain why underlying demand for gold can persist even during periods of tighter monetary conditions or market corrections. Central bank buying, in particular, reflects longer-term reserve allocation decisions that are generally less sensitive to individual Fed meetings or short-term price movements.
Key Technical Levels to Watch in Gold
Short-Term Gold Price Outlook
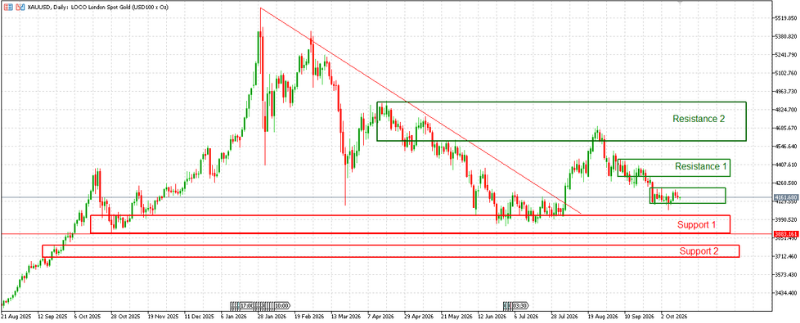
Gold is trading around $4,150 after giving back most of its August rebound. The late-July break above the descending trendline from the January high was technically constructive, but the recovery stalled in August near $4,700, before reversing sharply.
Since then, gold has formed a narrower consolidation around the $4,100–$4,250 area. The first test on the upside is Resistance 1 around $4,300–$4,450, where several September rebounds were capped. A sustained move above this zone would improve the short-term structure and bring the broader $4,600–$4,850 Resistance 2 region back into focus.
On the downside, a break below the current consolidation would shift attention to Support 1 around $3,880–$4,050. This is the more important medium-term support area, as gold previously based around this region during the June–July correction and traded around it in late 2025. A sustained break below Support 1 would weaken the broader recovery structure and expose Support 2 around $3,710–$3,790.
Overall, the chart now shows gold caught between a developing short-term base and overhead resistance. Holding above the current $4,100 area keeps the possibility of another challenge towards Resistance 1 alive, but gold would need to reclaim the $4,300–$4,450 region to regain momentum. A failure to hold the current base, meanwhile, would make the deeper Support 1 zone the key test for the broader bullish structure.
Source: Phillip MetaTrader 5
Long-Term Gold Price Outlook: Will History Repeat?
Historical comparisons can help assess whether the current recovery resembles past price scenarios, but they are best treated as reference points rather than forecasts.
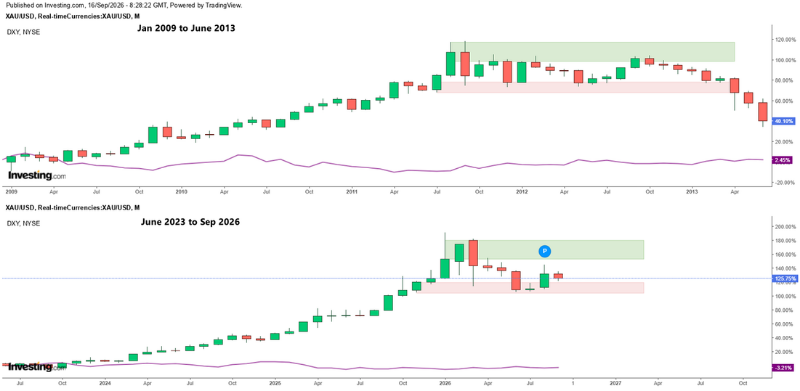
Gold’s recent three-year structure shares some similarities with the period following the 2011 peak. In both cases, a strong rally was followed by a sharp correction, support formation and a subsequent recovery attempt.
That invites comparison with 2012–2013, when gold failed to reclaim its previous high and later entered a much deeper decline.
However, the US dollar environment differs. DXY was more volatile during earlier period, and strengthened from mid-2011 into 2013 as gold weakened. In the current cycle, the US dollar has shown comparatively weaker momentum in both directions, even after gold’s correction.
Meanwhile, gold’s advance since 2024 has been substantially stronger than during the earlier period.
Source: Investing.com
History may rhyme, but it does not simply repeat. While the similarities in price structure are worth monitoring, differences in the US dollar backdrop, investment demand, central-bank purchases and broader macroeconomic conditions mean the current cycle could develop differently from 2011–2013.
The Path Ahead for Gold
Gold enters the rest of 2026 with a mixed outlook. Following the Fed’s September rate hike, the extent of any further tightening, together with Treasury yields and the US dollar, is likely to remain important for near-term moves. Investment flows, geopolitical uncertainty and central-bank demand may continue to shape the broader trend.
From a technical perspective, attention remains on how gold behaves around major support and resistance zones.
With Phillip Nova, traders can access real-time gold charts and monitor related markets, including the US dollar index and spot forex, on Phillip MetaTrader 5.
New to trading? Open a demo account to explore the platform and monitor gold alongside related markets.
About the Author
Chen Yurui
Strategist
Chen Yurui graduated from the National University of Singapore with a major in Finance and is currently a CFA Level III candidate. He has experience in financial market analysis and OTC derivatives, with a focus on FX, precious metals, CFDs and macroeconomic outlook.
Through his work, he has gained hands-on experience in algorithmic trading and trading systems, including developing, backtesting and optimising Expert Advisors (EAs) on MetaTrader 5. He aims to make financial markets and trading concepts more practical and accessible to investors.