By Danish Lim, Senior Investment Analyst, Phillip Nova
The SiMSCI Index (MSCI Singapore Free Index) tracks the performance of large- and mid-cap stocks in Singapore and serves as the underlying benchmark for the SGX-listed SiMSCI Index Futures. The index consists of 16 constituents and represents roughly 85% of Singapore’s free float-adjusted equity market capitalisation. Among local equity derivatives, the SiMSCI Futures contract stands out as the most liquid equity index futures product in Singapore.
As of market close on 29 December, the SiMSCI Index delivered a year-to-date total return of 25.23% in SGD terms, underscoring the strong performance of Singapore equities in 2025.
Index Composition and Growth Bias
As at 28 November, the index’s top six constituents include Singapore’s three major banks — DBS, OCBC, and UOB — alongside Singtel, and internationally listed technology platforms Sea Ltd and Grab Holdings. This blend gives the SiMSCI a higher growth and volatility profile compared to the Straits Times Index (STI), making it a more attractive instrument for investors seeking higher-beta exposure within the Singapore market.
Supportive Macro and Policy Backdrop
We remain constructive on Singapore equities, supported by a combination of reasonable valuations, resilient economic fundamentals, and favorable policy developments. Singapore’s reciprocal tariff rate of 10% is among the lowest in Asia, and it remains the only Asian economy with a AAA sovereign credit rating.
Monetary conditions have also eased meaningfully. The 3-month Singapore Overnight Rate Average (SORA) has fallen to around 1.19%, its lowest level since mid-2022, compared to roughly 3% at the end of 2024. Lower interest rates have supported banking activity, with loan growth accelerating to 6.6% in October, nearly double the pace recorded a year earlier.
Meanwhile, the property market has shown renewed strength. New private home sales (excluding executive condominiums) reached 10,624 units in the first 11 months of 2025, surpassing total sales for the entirety of 2024.
Valuations and Yield Appeal
Valuations remain attractive both historically and relative to global peers. The SiMSCI currently trades at around 16.4x LTM earnings, representing a roughly 40% discount to the S&P 500’s 27.6x, and below its own five-year average of 18.0x. In addition, a 12-month trailing yield of approximately 3.8% enhances the index’s appeal in a declining interest-rate environment.
Structural Catalysts Ahead
Several upcoming initiatives could further boost market liquidity and participation. These include the SGX–Nasdaq dual-listing bridge, expected to launch around mid-2026, as well as proposed measures to reduce board lot sizes for higher-priced stocks. Investor sentiment has also been supported by the Monetary Authority of Singapore’s S$5 billion Equity Market Development Programme (EQDP), which is likely to serve as a long-term structural tailwind.
Corporates are increasingly focusing on shareholder returns through higher dividends and share buybacks, reinforcing the investment case for Singapore equities.
Longer-Term Outlook and Key Risks
Looking further ahead, we expect the 3M-SORA to continue trending lower, especially as markets anticipate a potentially more dovish US Federal Reserve leadership following the conclusion of Jerome Powell’s term in May 2026.
Recent earnings from Sea Ltd and Grab Holdings were mixed. Grab shares rose after narrowing its full-year guidance following a quarterly beat, while Sea Ltd fell sharply after higher expenses weighed on profits. Upcoming earnings releases from Grab (19 February 2026) and Sea (4 March 2026) will be key drivers for the SiMSCI Index. Market speculation has also intensified around a potential Grab–GoTo merger, which could consolidate as much as 85–90% of the regional ride-hailing market.
Technical Outlook: SiMSCI Index Futures
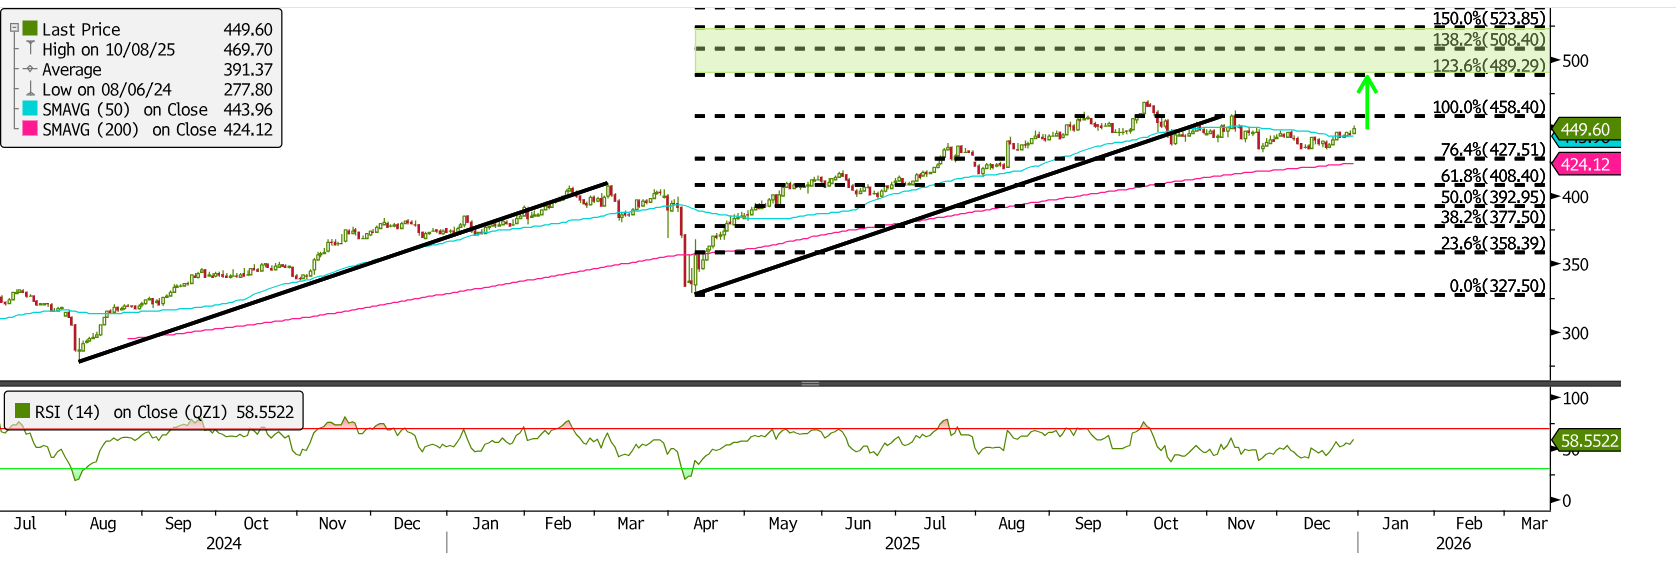
From a technical perspective, the SiMSCI Index Futures contract has staged a strong recovery from its 10 April low of 327.50. Fibonacci extensions drawn from the August 2024 low, March 2025 high, and April 2025 low suggest the contract could continue trending higher, with a potential year-end range between 490 (123.6% extension) and 525 (150% extension).
Following a breakout above the 76.4% extension level at 427.51 in mid-August — aided by a sharp rally in Sea Ltd after earnings — the contract has largely consolidated between 427.51 and 458.40. Geopolitical tensions in October temporarily weighed on sentiment, but conditions stabilised after tariff-related tensions eased.
Looking ahead, a daily close above 458.40 would confirm further upside potential, while a sustained break below 427.51, which aligns with the 200-day moving average, would invalidate the bullish setup. Momentum indicators remain supportive, with the 14-day RSI near 58.5, suggesting room for further gains before overbought conditions emerge.
Trade the SiMSCI Futures at just S$1.38 now!
Click here to learn more about our exclusive SiMSCI Futures promotion now!
Phillip Nova also offers access to Singapore Stocks and STI ETFs. Click here to open an account to get started now.
Or click here to learn more about our special promotion for the Phillip-Nova MSCI Singapore Daily L&I Products now.
Trade CFDs, ETFs, Forex, Futures, Options, Precious Metals, and Stocks on NOVA
Features of trading on NOVA
- Gain Access to Over 20 Global Exchanges
Capture opportunities from over 200 global futures from over 20 global exchanges - Trade Opportunities in Global Stocks
Over 11,000 Stocks and ETFs across Singapore, US, China, Hong Kong, Malaysia and Japan markets. - Charting Powered by TradingView
View live charts and gain access to over 100 technical indicators - True Multi-Asset Trading
Trade CFDs, ETFs, Forex, Futures, Options, Precious Metals and Stocks on a single ledger on NOVA - USD Shares Margin Rate at Only 4.5% p.a
- Fractional Shares from US$1