Return of Inflation: Why the Greenback is Tracing a Path to 116

15 Jun 2026

By Eric Lee, Sales Director, Phillip Nova


The release of the blockbuster May 2026 U.S. Jobs Report on June 5, 2026, delivered a profound shock to global financial markets. Paired with a hot headline consumer price index (CPI) hovering around 3.8%, the narrative of incoming Federal Reserve interest rate cuts has been decisively broken.


Instead, the market is suddenly pricing a ~70% probability of a Fed rate hike before the end of the year. As the newly appointed Fed Chair Kevin Warsh prepares for his first formal FOMC policy meeting on 16–17 June, the macro conditions are aligning for a powerful structural breakout in the U.S. Dollar Index (DXY).


1) The Macro Catalyst: A “1970s” Inflation Parallel

Source: yardeni.com


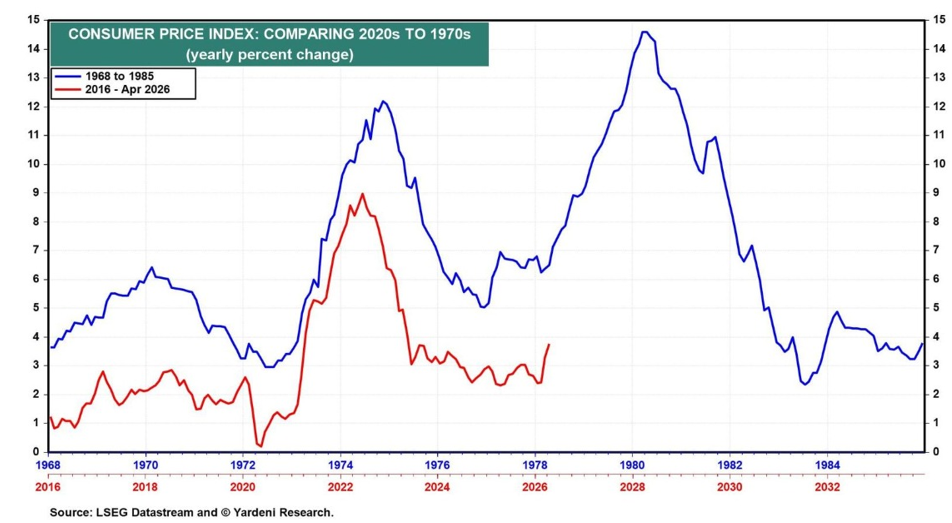
The macro environment is drawing strong comparisons to the stagflationary era of the 1970s. As illustrated in the consumer price index comparison chart, the red line (the 2020s cycle) is tracing a path highly reminiscent of the sharp upward trajectory seen in the 1970s blue line.


With non-farm payrolls exploding at 172,000 jobs (more than double the 80,000–85,000 consensus) and wages rising 3.4% year-over-year, domestic labor resilience is threatening to trigger a secondary wage-price spiral. Capital flows are shifting rapidly as the reality of “higher-for-even-longer” interest rates settles in, sucking liquidity out of emerging markets and high-multiple tech back into the dollar.


2) Technical Analysis: The Multi-Year Price Channel

Source: symbolik.com


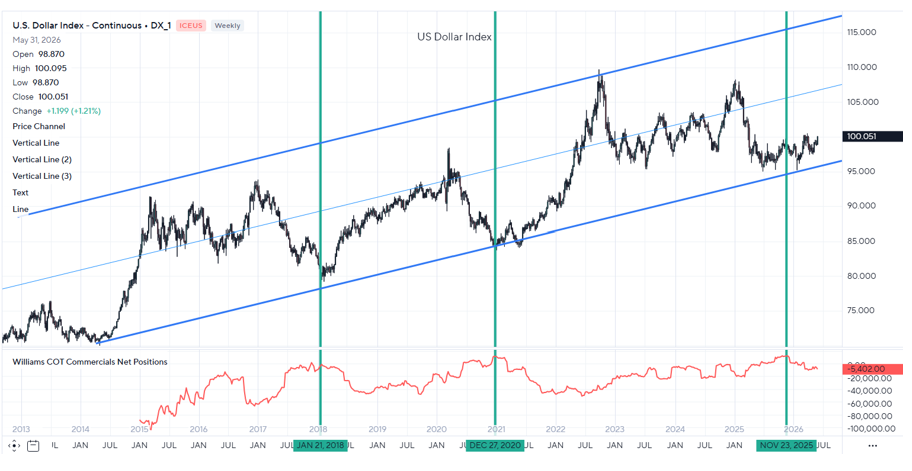
On the weekly chart, the U.S. Dollar Index continues to trade within a beautifully defined, ascending Price Channel that stretches back over a decade.

  • The Current Spot: The DXY recently reclaimed the psychological 100.051 level following the jobs report beat. This recovery bounced cleanly off the lower support boundary of the primary channel.
  • Tactical Mid-Point Target ($108): In the medium term, as the yield curve steepens and the 10-year Treasury yield moves higher (currently touching 4.55%), the DXY has clear air to play “catch-up” toward the channel’s median line at 108.000.
  • Strategic Upper Boundary Target ($116): If Kevin Warsh takes a hawkish stance at the June meeting and formally opens the door to rate hikes, the DXY is technically positioned to make a full run to the absolute ceiling of the channel near 116.000.
  1. Smart Money Validation: The COT Signal


The structural bullishness of this trade is validated by the Commitment of Traders (COT) data for the U.S. Dollar Index.


Historically, each time the Williams COT Commercials Net Positions (the red line at the bottom of the chart) moves up toward the zero line – signaling a significant reduction in short hedges – it has marked a major cyclical bottom for the dollar (as highlighted by the vertical green lines in 2018, late 2020, and late 2025).


Going into mid-2026, the Commercials have maintained a highly defensive posture, refusing to build aggressive net-short positions. This “Smart Money” positioning shows that institutional players have been quietly preparing for a breakout, recognizing that the global currency system faces severe dollar scarcity as the Fed changes its policy trajectory.


Technical Analysis

  • Biases: Potentially Strongly Bullish.
  • Execution Strategy: You can consider accumulating long USD positions on any minor pullbacks toward the 99.00 support floor.
  • Targets: Tactical target at 108.00, with a multi-month macroeconomic target of 116.00 at the upper channel resistance.


The macro data has provided the spark, the price channel provides the roadmap, and the Smart Money is already on board.


To learn more about the NOVA platform and how to start trading this ETF, simply register your interest via my 1 to 1 coaching page here.


Eric Lee is a Sales Director with Phillip Nova. With expertise in Futures, Forex, Stocks, and Unit Trust, Eric makes an all-rounded advisor. Make informed trading decisions without spending time combing through endless information as Eric readily provides clients with trade alerts and insights via WhatsApp. Over his years of experience, Eric developed systematic strategies in trading and investing. Book a complimentary coaching session below to leverage on his expertise as he imparts his knowledge to enhance your trading journey.

An Exchange Traded Fund (ETF) is a marketable security that is formed to track nearly anything, ranging from a specific index, sector, commodity, or increasingly, theme. They are most commonly used to track a basket of stocks, and can typically be accessed through the same channels as regular stocks. ETFs are typically separated into passively-managed ETFs that simply mirror the security they are tracking (e.g. the STI), and actively managed ones that attempt to deliver higher returns or specific investment objectives, often with a pre-specified theme in mind (e.g. ARK Invest’s Innovation ETF).

Why should I trade in ETF CFDs?

  • ETFs have been growing in popularity over the years. 2020 was the best year for ETFs yet, with global equity ETFs seeing more than $1T in inflows within a 12-month period. Using CFDs to gain exposure to ETFs allows for greater capital efficiency because only a portion of the contract value is required as margin to establish a position.
  • ETFs are particularly popular with investors seeking a relatively hassle-free investing experience, while desiring exposure to a range of specific and relatively understandable securities. Trading ETF CFDs brings greater convenience by eliminating the need for traders to hold multiple currencies in order to access global ETFs.
  • An investor wanting exposure to the post-pandemic economic recovery could open a position in the well-known SPDR S&P 500 ETF (SPY), which tracks the performance of the S&P 500. Another investor that may be convinced of the future importance of Environmental, Social and Governance concerns (ESG) may find the increasing selection of ESG-themed ETFs that track a basket of high ESG-rating companies to be a good investment, rather than cherry-picking individual equities by hand. ETF CFDs can act as a powerful tool for traders can profit from both directions of the market by taking on long or short positions.

A look at two ETF CFDs we offer:

1) Has the ARKK been sunk?

ARK Innovation ETF (ARKK) ARKK is an actively managed ETF by ARK Invest that invests in a range of companies based on their innovative and industry-disrupting potential. ARKK’s largest holdings are in companies such as Tesla, Square, and Zoom. ARKK is down around -33% from peaking on 12th Feb and is currently in the red for the year to date as the market experiences a risk-off outflow of funds. Superstar fund manager Cathie Wood has however been consistently doubling down on her bets, buying even more shares in growth stocks that are going through their own tumultuous periods such as DraftKings, Peloton, Teladoc, and Tesla. In her view, ARKK is playing the long game, and remains steadfastly convinced in the long-term prospects of these growth stocks beyond this current bout of volatility. Similarly on outflows, investors are still betting big on ARKK as ARK Invest has only lost about $1.2B in assets this year across all its six funds, compared to seeing an inflow of $15.1B during the same period. Recently, investors have been nervously eyeing ARKK’s basket of tech stocks as their future earnings potential remain vulnerable to erosion through high inflation – the dominant concern of the market in recent weeks. As commodities – the major contributor to the recent heightened inflation fears – drops sharply from record highs, are investor concerns over hyperinflation overblown?

2) Searching for exposure to Asian equities?

iShares MSCI Asia ex Japan ETF (AAXJ) The AAXJ is currently trading -10.6% adrift of all-time highs seen in February, giving up gains in tandem with an Asia-wide equity sell-off at the time. Given that slightly over 40% of the ETF’s holdings are based in China, the ongoing tumult seen in Chinese equities currently have carried over nearly perfectly in the AAXJ, as Chinese investors take a breather after the stellar gains made over the past year. Looking ahead, Asia – and particularly China, is steaming ahead with its economic recovery. China is widely expected to be one of the best-performing major economies this year, providing a major boost to the outlook for corporate earnings. As the rest of Asia and the world gradually opens up their own economies, AAXJ is likely to again benefit from strong Asian outperformance amidst a strengthening trade outlook.

CFD is available for trading on Phillip MetaTrader 5 (MT5).

Features of trading CFD:

  • Trade in both the bull and the bear markets
    The ability to enter a long and/or short position allow traders to take advantage of both rising and falling markets.
  • Smaller barrier to entry
    Flexible and smaller contract sizes. This means that traders will be able to enter into a contract with a modest amount of capital.
  • No expiration date or risk of delivery
    Unlike futures which commonly have a fixed expiration date, CFD allows traders to perpetually hold the position(s). CFD is cash settled, no need to worry about the delivery of the underlying asset.


Benefits of using Phillip MT5:

Trade at zero commission on a dynamic platform that offers low spreads. Integrated with Autochartist and Trading Central Indicators, and available on mobile, web and desktop app, you will never miss a trading opportunity with Phillip MT5.

Register for a FREE 30-day Phillip MetaTrader 5 Demo Account

More Market Trends

Gold Slips Towards $4,200: Is More Downside Ahead?

Read More >

Understanding inverse products across different market scenarios

Read More >

Gold Slips Towards $4,200: Is More Downside Ahead?

Read More >